Articles by Tracey

I like data and think it should be shared at not cost! Especially public data!

MPs will be debating Bill C-626 which proposes amending the Statistics Act this Friday November 7 to:

Reinstate the long-form census and expand the authority of the Chief Statistician of Canada.

The first reading of the text of An Act to Amend the Statistics Act / Projet de Loi C-626 Prèmiere Lecture was done on Sept. 22, 2014.

It was tabled by Ted Hsu, Liberal Member of Parliament for Kingston.

Here are some resources:

  1. Fortunately, Evidence for Democracy has taken this on as a campaign, and the
  2. Save The Census folks are also keeping us up to date on this issue with their Facebook page.
  3. Ted Hsu also has some excellent information resources in the Bill C-626 Blog
  4. the Datalibre.ca blog has a number of resources, which you can search
  5. The Civicaccess.ca list also keeps an archives of all of its posts, and you can search find excellent resources there as well.
  6. OpenParliament.ca has the essentials about the Bill
  7. Canadian Centre for Policy Alternatives (CCPA) – All the latest on the census long-form debacle

Some recent articles:

ACTIONS:

Tags: , , ,

Below is and excerpt from a blogpost on the Programmable City website.  I work there now, and post quite a bit of open data, big data, data infrastructure posts there.  Most do not include any CanCon so I do not always put them here.  The Open Government Partnership is big for the Federal Government in Canada, and the OGP Independant Reporting Mechanism report by the Independant Reviewer Dr. Mary Francoli, was not particularly kind to our Action Plan, and rightly so.  The OGP is however not that big a deal on the ground or with civil society in Canada.  It is however really important elsewhere, in Ireland for example, the EU and the OGP are leveraged as a way to bring and promote progressive practices, regulation, laws, and so on.  In developing countries, it is a way for civil society organizations to have a voice and meet officials they would otherwise not get to interact with at home, and again have a transnational organization promote change.

I will try and post here more often!  Took me time to adjust to my new home.  Rest assured though, that I have not forgotten you nor do I not pay attention to the data shenanigans ongoing in Canada!

********************************

I attended the European Regional Meeting of the Open Government Partnership at the Dublin Castle Conference Centre in May of this year.  The meeting was a place for performance and evaluation wonks to show their wares, especially at the following sessions: Open Government Standards and Indicators for Measuring Progress, The EU’s Role in Promoting Transparency and Accountability and Engagement with the OGP, and Open Contracting: Towards a New Global Norm.  I did not attend the Independent Reporting Mechanism (IRM) sessions, but having read the IRM report for Canada, I know that it too is an emerging performance evaluation indicator space, which is affirmed by a cursory examination of the IRMs two major databases.  The most promising, yet the most disappointing session was the Economic Impact of Open Data session.  This is unfortunate as there are now a number of models by which the values of sharing, disseminating and curating data have been measured.  It would have been great to have heard either a critical analysis or a review of the newly released Ordinance Survey of Ireland report, Assessment of the Economic Value of the Geospatial Information Industry in Ireland, the many economic impact models listed here in the World Bank Toolkit, or the often cited McKinsey Global Institute Open data: Unlocking innovation and performance with liquid information report.  Oh Well!

While there I was struck by the number of times maps were displayed.  The mapping of public policy issues related to openness seems to have become a normalized communication method to show how countries fare according to a number of indicators that aim to measure how transparent, prone to corruption, engagemed civil society is, or how open in terms of data, open in terms of information, and open in terms of government nation states are.

What the maps show is how jurisdictionally bound up policy, law and regulatory matters concerning data are.  The maps reveal how techno-political processes are sociospatial practices and how these sociospatial matters are delineated by territorial boundaries.  What is less obvious, are the narratives about how the particularities of the spatial relations within these territories shape how the same policies, laws and regulation are differentially enacted.

Below are 10 world maps which depict a wide range of indicators and sub-indicators, indices, scorecards, and standards.  Some simply show if a country is a member of an institution or is a signatory to an international agreement.  Most are interactive except for one, they all provide links to reports and methodologies, some more extensive than others.  Some of the maps are a call to action; others are created to solicit input from the crowd, while most are created to demonstrate how countries fare against each other according to their schemes.  One map is a discovery map to a large number of indicators found in an indicator portal while another shows the breadth of civil society participation.  These maps are created in a variety of customized systems while three rely on third party platforms such as Google Maps or Open Street Maps.  They are published by a variety of organizations such as transnational institutions, well resourced think tanks or civil society organizations.

We do not know the impact these maps have on the minds of the decision makers for whom they are aimed, but I do know that these are often shown as backdrops to discussions at international meetings such as the OGP to make a point about who is and is not in an open and transparent club.  They are therefore political tools, used to do discursive work.  They do not simply represent the open data landscape, but actively help (re)produce it.  As such, they demand further scrutiny as to the data assemblage surrounding them (amalgams of systems of thought, forms of knowledge, finance, political economies, governmentalities and legalities, materialities and infrastructures, practices, organisations and institutions, subjectivities and communities, places, and marketplaces), the instrumental rationality underpinning them, and the power/knowledge exercised through them.

This is work that we are presently conducting on the Programmable City project, which will  complement a critical study concerning city data, indicators, benchmarking and dashboards, and we’ll return to them in future blog posts.

1.       The Transparency International Corruption by Country / Territory Map

Users land on a blank blue world map of countries delineated by a thick white line, from which they select a country of interest.  Once selected a series of indicators and indices such as the ‘Corruption measurement tools’, ‘Measuring transparency’ and ‘Other governance and development indicators’ appear.  These are measured according rankings to a given n, scored as a percentage and whether or not the country is a signatory to a convention and if it is enforced.  The numbers are derived from national statistics and surveys.  The indicators are:

  • Corruption Perceptions Index (2013), Transparency International
  • Control of Corruption (2010), World Bank dimension of Worldwide Governance Indicators
  • The Bribe Payer’s Index (2011), Transparency International
  • Global Corruption Barometer (2013), Transparency International
  • OECD Anti-Bribery Convention (2011)
  • Financial Secrecy Index (2011), Tax Justice Network
  • Open Budget Index (2010), International Budget Partnership
  • Global Competitiveness Index (2012-2013), World Economic Forum Global Competitiveness Index
  • Judicial Independence (2011-2012), World Economic Forum Global Competitiveness Index
  • Human Development Index (2011), United Nations
  • Rule of Law (2010), World Bank dimension of Worldwide Governance Indicators
  • Press Freedom Index (2011-2012) Reporters Without Borders
  • Voice & Accountability (2010), World Bank dimension of Worldwide Governance Indicators

By clicking on the question mark beside the indicators, a pop up window with some basic metadata appears. The window describes what is being measured and points to its source.

The page includes links to related reports, and a comments section where numerous and colourful opinions are provided!

*****************************

View the rest at Programmable City.
Tags: , , ,

Participants at the 2014 Open Data Summit in Vancouver this year put their heads together to come up with a list of desired open data datasets.  The ever so wonderful Herb Lainchbury then:

  • consulted with open data enthusiast on the Civicaccess.ca list to narrow it down and refine it;
  • created an online survey;
  • solicitied people across the country to vote on it;
  • and then shared the survey results.

The final list is as follows:

  1. Rezoning permit applications
  2. Land use changes
  3. Financial data (revenue, expenses, liabilities, equity, etc..)
  4. Locations of things (fire hydrants, drinking water fountains, public toilets, bike parking, …)
  5. Transit data
  6. Development permit applications
  7. Crime information
  8. Road construction (511 data)
  9. Political financing
  10. Real time traffic flow data and daily road usage patterns
With #1 being the most desired.


As discussed here, and here, the folks on the CivicAccess.ca list are doing some digging into the numbers behind this Canada post announcement to cancel home delivery of the mail.  In addition, Armine Yalnizyan’s Globe and Mail Article Canada Post’s vow to ‘protect taxpayers’ needs a reality check which questions the validy of reported losses in financial reports.  As part of that digging some of the following links are being made.  And of course the following National Post Article Canada Post CEO Deepak Chopra is a board member of the think-tank that urged mail changes revealed that:

Chopra is also paid the highest salary range among so-called governor-in-council cabinet appointments, with potential earnings of more than half a million dollars a year as Canada Post CEO. Chopra is paid at the CEO 8 level, meaning he receives between $440,900 and $518,600 a year in salary to head an organization that has nearly two dozen presidents and vice-presidents.

Here are some findings about the CEO, his relationship with the Conference Board of Canada and also with Pitney and Bowes which runs a private sector mail service:

reorganized the postal business into two distinct business units: a Physical Delivery Network, which offers highly competitive mail and parcel delivery to every household; and a Digital Delivery Network, which is responsible for the epost electronic delivery solutions, online properties and consumer experience while supporting the Direct Marketing industry with location data analytics.

The report, L’Avenir du service postal au Canada / The Future of the Postal Service included some numbers and references to some interesting data shops as follows:

  • The econometric analysis discussed in chapter 1 of this report was done by ZenithOptiMedia is also a media agency with shops in Toronto and Montreal. The algorithms were not provided nor the data sources. It is a big data analytical shop
  • Dunn and Bradsheet supplied some corporate data.  According to them, they are “the world’s leading source of commercial information and insight on businesses”.  They also do credit scores.
  • Genesis Public Opinion Research Inc did the public opinion research. Not much is available about this company, they do however have a standing offer with the Government of Canada to do this this type of research.  And if this link to them is correct they are a shop based in Chelsea, QC with one employee? s http://www.salespider.com/b-143469756/genesis-public-opinion-research-inc, one employee?

The data from which it was decided that Canada Post should change its direction was not provided in the report, the following was:

  • “The target sample included approximately 500 customers who get mail delivered to their door (DTD), 300 who use group mailboxes (CMB), 250 who receive mail in their lobby or common area (LBA), 100 who have mail delivered to the end of their driveways (RMB), and 60 who have postal boxes in Canada Post or private buildings (DFLB). This roughly mirrors the current distribution of customers by delivery category, with an oversample of rural driveway customers”.
  • “A total of 1,212 residential customers, 18 years of age or older, were surveyed by telephone from September 26 to October 10, 2012. The results are considered accurate to within +/- 2.8 per cent, 19 times in 20.”
  • “Genesis explored the views of small businesses through a two-stage process. The first stage was a series of five focus groups, held in Moncton, Montréal, Mississauga, Brandon, and Calgary. The second stage involved a telephone survey of individuals in small businesses who make decisions on postal products and services within their company.”
  • “The interviews were conducted with 800 businesses selected randomly from among a nationwide pool of businesses with more than 1 but fewer than 100 employees. The sample was generated using data from Dunn and  Bradstreet. The source data for the sample were stratified by employee size, region, and Standard Industrial Classification (SIC). Only businesses with 2 to 100 fulltime employees were eligible for inclusion in the final sample. The sample was then randomly drawn from businesses across the full range of over 1,000 SIC codes, but it excluded Canada Post, print and electronic media, hospitals, educational institutions, and all three levels of government”.

To summarize, this unbiased report was produced by an organization, who has as its board member, the proponent of the research who also happens to be the CEO of the Crown Corporation which is proposing the radical changes, furthermore, this CEO was also the president and CEO of a company that has a private sector mail service that may benefit from these changes, and he is paid close to 520K per year by the Crown / governor in council who appointed him, of an organization that is fasely reporting losses.  In addition the data sources and algorithms behind the reports are not made available, while the sampling of the population is small and primarily urban and even these small numbers were also misreported.

Maybe it is just me, but it would seem that something is a little off here. And, there seems to be a pattern, the cancelation of the census in 2010 was announced just before the summer holidays, the cancelation of home delivery of the post was announced just before the Xmas holidays of 2013, and we have a Prime Minister who seems to have an aversion to evidence based decision making.

It would be good to know who stands to gain with this Canada Post decision, a quick glance tells me that the Canada Post Digital Delivery Network, Direct Marketing industry with location data analytics gain, and that would include companies like Pitney and Bowes, while the Physical Delivery Network which is the one that serves the public, loses.

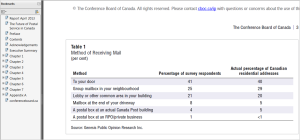
A member of the Civicaccess.ca list, Ted Strauss, was perplexed about  a Canada Post data point frequently reported in the media!  It has oftern been repeated that “2/3rd of Canadians already don’t receive home delivery” which seemingly justifies the cancellation of mail delivery to the doors of Canadians.  In a sense this is manufacturing concent for the cancellation! Another member of the list, Jean-Noe Landry pointed us to the following ‘unbiased’ report  by the Conference Board of Canada: The Future of Postal Service in Canada. On page 3 of that report, Ted found the following table:

p3_ConferenceBoardofCanada_FutureofthePostalService

Here is what it reveals:
  • 40% get mail to their door.
  • 20% get mail in the lobby of their building.
  • 5% get mail at the end of their driveway.
  • That’s a subtotal of 65% that most sane people would define as “to their door”.
  • 29% get mail at a group mailbox in the neighbourhood.
  • 5% get mail at the post office.
Accroding to this data, two thirds of Canadians actually DO get mail delivered to their domicile, even if said mail is not directly touching their front door.

Ted was good enough to also share several examples where this two thirds figure has been cited.  While a complicated issue, the focus on this one number is helpful.

“Over the next five years, the one third of Canadian households that receive their mail at their door will be converted to community mailbox delivery. This change will provide significant savings to Canada Post and will have no impact on the two thirds of Canadian households that already receive their mail and parcels through community mailboxes, grouped or lobby mailboxes or rural mailboxes.”

Canadians are being deceived, and once again the devil is in the details of the data!

UPDATE: Another member of the list, Karl Dubost went further.  Karl elicited a to do list of follow up questions that I parphrase as follows:

  1. These data were collected by Genesis Public Opinion Research Inc.
  2. What is the sample size?
  3. What regions did they sample from?
  4. Did they sample secondary households (i.e., cottages and so on)
  5. What are the stats by different areas across Canada with the labeling and the density of the area?

You can follow the discussion on the Civicaccess.ca list, by all means join, or look into the stream of the discussion archived here.


Tags:

Here we go again!

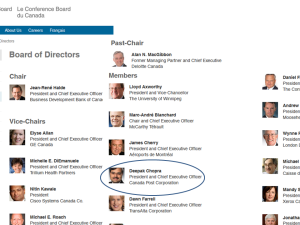
The Conference Board of Canada, well, they just don’t seem to get this unbiased reporting thing straight. For instance, a member of their board, Deepak Chopra who is the President and Chief Executive Officer Canada Post Corporation, well, need I say more? How does one produce an independent unbiased think tank report, when… This is not the Conference board of Canada’s first little oopsy, on this front, recall the The Conference Board of Canada’s Deceptive, Plagiarized Digital Economy Report, as meticulously deconstructed by Michael Geist.

The report was downloaded and reposted in slideshare for posterity’s sake. Should you wish your own copy, by all means go to the Conference Board of Canada’s website and download: The Future of the Postal Service in Canada. We all want informed decision making, but really?

I also screen captured the list of the Conference Board’s board members and composed the following png. I captured these images from the following link, today, 16 Dec. 2013, http://www.conferenceboard.ca/about-cboc/bod.aspx. I recommend you do the same before this too disappears from the record!

ConferenceBoardCanada_Board_16122013

Thank you friends on the CivicAcces.ca list for pointing me to these!

Voici le rapport en Francais, qui est disponible ici du Conference Board of Canada.

OPEN DATA FOR DEVELOPMENT CHALLENGE

January 27-28, 2014 – Montreal, Canada

The Department of Foreign Affairs, Trade and Development (DFATD) is pleased to announce an international aid transparency event will be held in Montreal (Canada) on January 27 and 28, 2014.

The event, which will take the form of a “codathon”, will focus on data, policy, and technical questions related to aid transparency. It will bring together technical experts and practitioners to generate new tools, approaches and ideas in the fields of open data and aid transparency in order to address development issues.

Technical challenges will involve building on open aid data, development-related datasets (e.g. national indicators, trade flows) and other data to build applications that help deliver better development results. Proposed topics for the policy stream include the use of open data in decision-making, the impact of open data in developing countries and an in-depth look at geospatial data.

Canada is committed to open data, aid transparency and accountability, as demonstrated through its engagement in key initiatives such as the G8 Open Data Charter, the Open Government Partnership and the International Aid Transparency Initiative (IATI). The Open Data for Development Challenge will build on DFATD’s commitment to aid transparency and its efforts to make data on Canada’s international development assistance open and accessible.

The Open Data for Development Challenge will take place in the same venue as the IATI TAG event (which will be on January 29-30, 2014). Participants in the TAG event are encouraged to plan to attend the Challenge as well

Details on the program and the registration process will be available shortly.

—-

Données ouvertes pour le développement

27 et 28 janvier 2014, à Montréal.

Affaires étrangères, Commerce et Développement Canada (MAECD) est heureux d’annoncer la tenue d’un événement sur la transparence de l’aide internationale les 27 et 28 janvier 2014, à Montréal.

L’événement prendra la forme d’un « codathon » portant sur les données, les politiques et les questions techniques liées à la transparence de l’aide. Il réunira des experts techniques et des praticiens, qui auront l’occasion de générer de nouveaux outils et de nouvelles approches et idées dans les domaines des données ouvertes et de la transparence de l’aide, dans le but de s’attaquer aux enjeux du développement.

Les participants devront relever des défis techniques, p. ex. s’appuyer sur des données ouvertes relatives à l’aide, des ensembles de données liées au développement (comme les indicateurs nationaux et les flux commerciaux) et d’autres données, afin de concevoir des applications permettant d’atteindre de meilleurs résultats en matière de développement. Parmi les sujets proposés pour le volet sur les politiques, soulignons l’usage de données ouvertes dans la prise de décisions, l’incidence des données ouvertes dans les pays en développement, et un examen approfondi des données géospatiales.

Le Canada a pris un engagement à l’égard des données ouvertes, de la transparence de l’aide et de la responsabilisation, comme le montre sa participation à des initiatives clés comme la Charte du G8 sur les données ouvertes, le Partenariat pour un gouvernement transparent et l’Initiative internationale pour la transparence de l’aide. Le défi Données ouvertes pour le développement fera fond sur l’engagement du MAECD à l’égard de la transparence de l’aide et sur ses efforts pour rendre ouvertes et accessibles les données sur l’aide canadienne au développement international.

Le défi Données ouvertes pour le développement aura lieu au même endroit que la réunion du Groupe consultatif technique de l’Initiative internationale pour la transparence de l’aide, laquelle se déroulera les 29 et 30 janvier 2014. Ainsi, les participants à la réunion du Groupe consultatif technique sont également invités à prendre part au défi Données ouvertes pour le développement.

Les détails sur le programme et le processus d’inscription seront diffusés sous peu.

Michael Roberts – Groupsia
skype: mroberts_112

This GeoConnections webinar discussed the results of a Social Sciences and Humanities Research Council (SSHRC) Funded Partnership Development Grant entitled Mapping the Legal and Policy Boundaries of Digital Cartography led by Dr. R. Fraser Taylor of the Geomatics and Cartographic Research Centre (GCRC), Carleton University, and Dr. Teresa Scassa of the Faculty of Law, Centre of Law, Technology and Culture (CLTS) at the University of Ottawa, including the Canadian Internet Public Policy Interest Clinic (CIPPIC) and GeoConnections.

The issues presented were:

  • Traditional Knowledge (TK) and cybercartography;
  • The complexities of Intellectual Property rights and TK;
  • Challenges and possible solutions with regard to Western law and TK;
  • The role of collaborative relationships in cybercartography in the North.

(182 particiants, from all provinces and territories including Malawi, Italy, USA, New Zealand and the UK)

Ce webinaire de GéoConnexions a présenté les résultats d’une subvention de développement, en partenariat avec le Conseil de recherches en sciences humaines (CRSH) : « Mapping the Legal and Policy Boundaries of Digital Cartography », dirigée par Dr. R. Fraser Taylor du Geomatics and Cartographic Research Centre (GCRC) de l’Université de Carleton, et Dr. Teresa Scassa, du Centre de recherche en droit, technologie et société, de la faculté de droit de l’Université d’Ottawa, en collaboration avec la Clinique d’intérêt public et de politique d’internet du Canada (CIPPIC) et GéoConnexions.

Vous apprendrez davantage sur les sujets suivants :

  • Le savoir traditionnel et la cybercartographie;
  • Les complexités de la propriété intellectuelle et le savoir traditionnel;
  • Les défis et les solutions possibles en matière de droit occidental et de savoir traditionnel;
  • Le rôle des collaborations en cybercartographie dans les régions nordiques.

(37 participans, Territoires du nord ouest, Colombie Britanique, Alberta, Saskatchewan, Ontario, Quebec et Terre neuve aussi Belgique, Danemark, Etats-unies et Royaumes unies)

Jean-Noe Landry and Tracey P. Lauriault have an article entitled:

Les données ouvertes : la matière première du nouvel engagement citoyen

in this fantastic almanac type of publication produced yearly by L’institut du nouveau monde. The article features the unique type of open data movement in Quebec, which is a rich combination of  community development, grass roots engagement, technological activism and public policy making.  It is one of the few Canadian open data initiatives that really make data work to change public policy by embedding the work into a political process, while concurrently working within the political process to ensure evidence informed democratic deliberation and keeping government accountable.

etatduquebec

L’État du Québec est publié une fois l’an depuis 1995. Destiné au grand public, il fournit aux lecteurs l’ensemble des données factuelles utiles sur le Québec dans tous les domaines. On y trouve également le bilan politique, économique, culturel et social du Québec pour l’année écoulée ainsi que des textes d’analyse, produits par des spécialistes, sur tous les grands enjeux auxquels le Québec est confronté.
UN GRAND DOSSIER : LE POUVOIR CITOYEN
• Historique de la participation publique au Québec
• L’éducation civique à l’école
• Les formes innovantes de la démocratie participative à travers le monde
• Le mouvement des données ouvertes
• Participation et corruption coexistent : comment l’expliquer ?


The article was co-authored by both of us, however, it is important to mention that Jean-Noe, in his true collaborative, consultative and democratic style, consulted a number of actors in the Montreal and Quebec open data space to ground the content in its local context.

On a seperate note, it is serendipitous that Jean-Noe read philosophie at Trinity in Dublin, I now live in Ireland, we both travelled in Japan and his mom was my French prof.  Life is very interseting sometimes!

Greetings folks!  Below is a presentation about the genealogy of open access to data and open data in Canada.  It was great to finally have the space to demonstrate the earlier work done in this space and to showcase the different open data open access communities.  The open data movement has a long history in Canada, and I believe we can thank research librarians and geomaticians for getting the ball rolling, at least if we tentatively assume that it began in the 80s and the use of the Internet.  The history of sharing data in science and geomatics does however go way back.

The other presentations which were part of the Programmable City Seminar discussed the Irish context at a County Council called Fingal level and the Irish Environmental Protection Agency.  They were great as they featured what it means for a public servant, citizen and a researcher to do this work.  Folks who follow open data in Canada would have been most impressed by their frank talks and their oratorial styles.  A video will be released in the coming weeks.

« Older entries § Newer entries »