politics

You are currently browsing the archive for the politics category.

It is quite surprising that this was not the norm, to manage the public good!

the Federal Court of Canada released late yesterday that it will force the federal government to stop withholding data on one of Canada’s largest sources of pollution – millions of tonnes of toxic mine tailings and waste rock from mining operations throughout the country.

The Federal Court sided with the groups and issued an Order demanding that the federal government immediately begin publicly reporting mining pollution data from 2006 onward to the National Pollutant Release Inventory (NPRI). The strongly worded decision describes the government’s pace as “glacial” and chastises the government for turning a “blind eye” to the issue and dragging its feet for “more than 16 years”.

I look forward to reading the court order. According to Ecojustice (Formerly the Sierra Legal Defence Fund) the ruling includes the following strong wording:

* It calls the federal government’s pace “glacial”[paragraph 145];
* It says the government’s approach has been simply to turn a “blind eye”[207];
* It notes that the frustration felt by advocates trying to uncover this information “after more than 16 years of consultation” is “perfectly understandable” [124];
* It states that not reporting “denies the Canadian public its rights to know how it is threatened by a major source of pollution”[127];
* It highlights that the minister has chosen not to publish the pollution data “in deference to” the mining industry[220];
* It used unusually simple language even I understand when it said that the government was simply “wrong”[177].

The advocates were: Justin Duncan and Marlene Cashin and their dedicated clients at Great Lakes United and Mining Watch Canada who launched the case in 2007.

It is uncertain how these data will be released. Currently, these types of pollutant data are released on the National Pollutant Release Inventory (NPRI) which is:

The National Pollutant Release Inventory (NPRI) is Canada’s legislated, publicly accessible inventory of pollutant releases (to air, water and land), disposals and transfers for recycling. (Mining Watch)

The NPRI is fairly usable & accessible, includes georeferencing and some mapping services. I tried to use their library and it was however not working!

The Mining Association of Canada wants to read the ruling “carefully” to assess how Environment Canada should release these data. I find this confusing, since I thought the Government got to decide how these data are to be released and what is to be included, and that decision was based on ensuring the public good and the public right to know. The fight is not yet quite over. It will be important to ensure the data are not watered down for public consumption.

It is another wonderful example of creating an infrastructure – NPRI + law – to distribute public data. This also teaches us something about gouvernementalité, and who the government thinks with, in this case the mineral and mining industry and not citizens. Citizens should not have to lobby for 16 years and expend incredible resources to get the courts to get the government to ensure the public good!

Articles:

  • Court orders pollution data from mining made public, By Juliet O’Neill, Canwest News ServiceApril 24, 2009
  • Environment Canada forced to reveal full extent of pollution from mines
    Court ruling considered major victory for green organizations
    , MARTIN MITTELSTAEDT, Saturday’s Globe and Mail, April 24, 2009
  • Great Lakes United Press Release, Court victory forces Canada to report pollution data for mines, April 24, 2009 – 11:16am — Brent Gibson
  • Mining Watch Press Release: Court Victory Forces Canada to Report Pollution Data for Mines, Friday April 24, 2009 11:31 AM
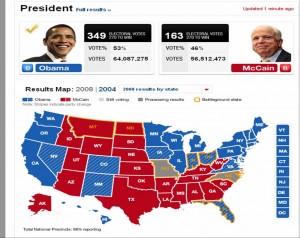
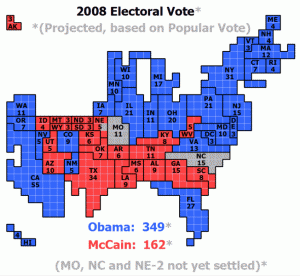
    The visuals I saw while watching the US elections on the tele on Tuesday were just plain dazzling.  Lots of speculative data, predictions, interactivity leading to scenarios and more speculation on the results, good visualizations, resulting from a visualization dissemination and creation infrastructure which manufactures the geographic imagination of the US Nation.  Obama stated in the speech that won him the candidacy for the Democrats (UK Guardian)

    that there were no red states, no blue states, only the United States.

    The maps we saw on US election night however, were all about blue and red differences.

    Map of results by state

    Map of results by state

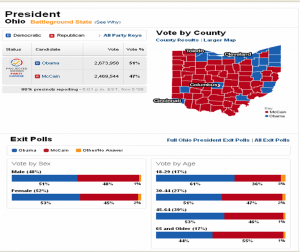
    Zooming into county maps shows a different picture where colour speckles add up to a uniform blue for Ohio on the state map above. Many voices are not seen on the state map, the county map shows lots of diversity, as would the sub county map.  Maps tell all sorts of stories and can portray silences or consensus where in fact cacophonies and polarities exist. The county map looks way more red than blue for the Democratically won state of Ohio.

    Speckles of red and blue in Ohio became a uniform Blue

    Speckles of red and blue in Ohio became a uniform Blue

    Reading about the US Electoral system helps explain how this works out.

    The map in popular culture is key to the formation of the collective imagination of the nation.  I do wonder if viewers will actually think that Hawaii and Alaska are really located in the ocean south of Arizona instead of one connected to Canada’s North and the other in the middle of the Pacific!

    1 square = 1 electoral vote

    1 square = 1 electoral vote

    Information Aesthetics produced an excellent blog post which includes links to numerous electoral visuals.  Watching this also highlighted the lack of maps and visuals during the Canadian 2008 Elections.  Eventually I did see a map on the Tele, around 11:30 PM on Radio Canada, while CBC showed none!

    I was looking for some cross city comparison data yesterday and recalled the Federation of Canadian Municipalities (FCM) Quality of Life Reporting System (QoLRS).

    Conçu par la FCM, le Système de rapports sur la qualité de vie mesure, surveille et fait état de la qualité de vie dans les villes canadiennes en utilisant les données provenant de diverses sources nationales et municipales. / Developed by FCM, the Quality of Life Reporting System (QOLRS) measures, monitors and reports on the quality of life in Canadian urban municipalities using data from a variety of national and municipal sources.

    Regroupant initialement 16 municipalités à ses débuts en 1999, le SRQDV compte maintenant 22 municipalités, dont certains des plus grands centres urbains du Canada et beaucoup de municipalités de banlieue qui les entourent. / Starting with 16 municipalities in 1999, the QOLRS has grown to include 22 municipalities, comprising some of Canada’s largest urban centres and many of the suburban municipalities surrounding them.

    The FCM’s QoLRS site includes all the documentation, data, metadata and methodologies related to the development of their indicators and the system they have developed.

    :: Reports
    :: Annexes
    :: Indicators

    Their data are most impressive.  You can download a spreadsheet of the data for each indicator for 1991, 1996, 2001 and I expect 2006 QoLRS will be coming soon.   Each variable was also adjusted to the current geographies of amalgamated cities which makes cross comparison across time and space possible (see the guide to geographies).  This was not easy to do at the time. Each spreadsheet includes the data source, the variable, and a tab that provides the metadata.  Which means that you can verify what was done, reuse those data or if you had some money & loads of time you could purchase & acquire the data pertaining to your city and add to the indicator system.  Unfortunately the FCM had to purchase these datasets and it cost them many many thousands of dollars.

    There are 11 themes and 72 indicators over 3 census periods for 20 cities (Sudbury, Regina, Winnipeg, Niagara, CMQ, Saskatoon, Edmonton, Hamilton, Halifax, Windsor, Toronto, Kingston, London, Ottawa, Vancouver, Waterloo, Halton, Calgary, Peel, York).  Datasets come from:

    • Statistics Canada
    • Canada Housing and Mortgage Corporation
    • Environment Canada
    • the 22 cities themselves
    • Elections Canada
    • Audit Bureau of Circulation
    • Tax Filer Data
    • Human Resources and Development Services Canada,
    • FCM Special Surveys
    • Industry Canada
    • Anielsky Management (Ecological Footprint)
    • Canadian Centre for Justice

    Putting something like this together is no small feat, so please go check out what is available, play with the data a little, and if you cannot find data for your city, call up your local councilor and ask them to become a member of the QoLRS team!  Also let the FCM know they are doing a good job, as this is one way for us Canadians to see what is going on in our cities overtime.

    Coalition Casualty Count is a site managed by independent US citizens who analytically count the coalition casualties

    for Operation Iraqi Freedom and Operation Enduring Freedom [Afghanistan]. We attempt to be up to date, precise, accurate and reliable.

    There are many other sites on the web that list information of Fatalities from Iraq , but few if any of them do this in an analytical fashion. We endeavor to provide not just a list of names but a resource detailing when, where and how fatalities occurred.

    You can read their methodology here.  I am always happy when I get to see the data and read how they were assembled, this provides me with the means to critically assess what is being presented to me.  I love the myriad visualization tools that are emerging on the net however, I wish they were accompanied by metadata which helps me better understand and decide whether or not I trust what is being said to me.

    There are alot of data points and even some maps on this site and these folks are commended for doing this work and telling this important story.  There is also a list of the Canadian men and women causalities in Afghanistan.

    via: Spatial Sustain

    This should be good, and pose some questions to the mission of datalibre.ca … questions we ought to be able to answer, if we are serious about what we’re trying to do.

    One Nation Under Google: Citizenship in the Technological Republic

    A public talk by Professor Darin Barney
    Canada Research Chair in Technology & Citizenship, McGill University.

    Friday, March 14, 2008
    Arts W-215, 853 Sherbrooke Street West, McGill University, Montreal
    18h30, free

    Does more technology equal more freedom? While the nuts and bolts of technological progress – computers, cellphones, internet access wired and wireless – become accessible to more and more people, the promise of increased civic engagement enabled by these gadgets seems to have eluded our wired society. There’s a lot more to technology, and to democracy, than wires and buttons, and it has a much deeper affect on our lives than simply being tools we can use well or badly.

    In Dr. Barney’s words, “technology is, at once, irretrievably political and consistently depoliticizing. It is at the centre of this contradiction that the prospects for citizenship in the midst of technology lie.” Presenting a range of examples from YouTube to the hidden networks of food production and government bureaucracy, Barney contests the common notion that technology necessarily leads to enhanced freedom and improved civic engagement. One Nation Under Google examines the challenge of citizenship in a technological society, and asks whether the demands of technology are taking over the practice of democracy.

    Presented in collaboration with CKUT 90.3FM

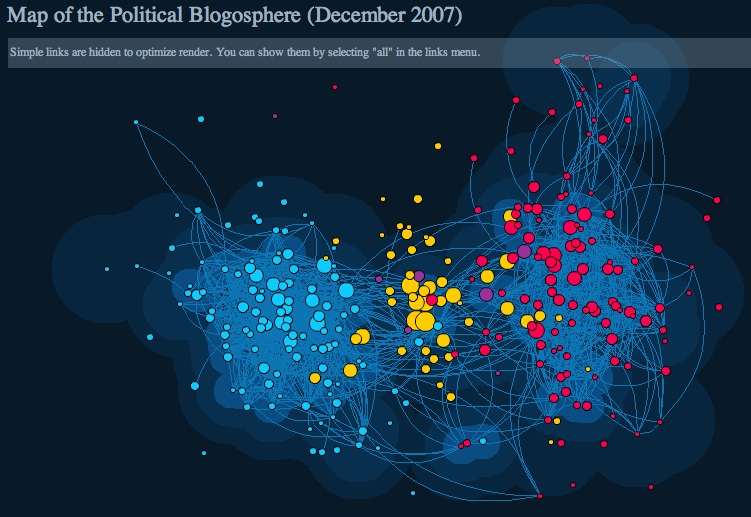
    us political blogmap It seems that there is an explosion of data visualization work being done on the political process and the Presidential election in the US of A. I just landed on PresidentialWatch08 a site for all you political junkie/blogospheria/dataviz fans. They’ve got a lovely map of influential political blogs and news sites. The project seems to be run by a web analytics company, linkfluence.

    Anyone planning anything similar in Canada?

    [via infosthetics]

    Newer entries »