I’m in an Advanced GIS class for which I need to produce a final cartographic project. The project must begin in ArcGIS but from there I’m free to use anything else (Illustrator, Flash, Google Earth, etc). In the spirit of John Snow, I’d like to make my upcoming trip to London a force for academic good.
When you’re dealing with a flooding emergency in the middle of the worst drought for many years, the last thing you need is barriers to the sharing of geographical and meteorological information.
Yet that’s the situation faced by Australia. The authorities’ response is to consider the widespread adoption of Creative Commons licences for public-sector information.
From The Guardian UK, via Free Our Data.
This encapsulates, to me, the most compelling argument for free data. That getting access to data helps us better solve problems; barriers to data make for a less innovative, less healthy country.
I subscribe to Open Access News, by Peter Suber, which is a blog about:
Putting peer-reviewed scientific and scholarly literature on the internet. Making it available free of charge and free of most copyright and licensing restrictions. Removing the barriers to serious research.
And a topic near and dear to datalibre.ca… The flow of announcements coming out of Open Access News is truly amazing. Universities and government agencies and quasi-governmental academic bodies, particularly in the US and Europe seem to be making statements on a daily basis – at least OA News is writing about them on a daily basis.
The front page currently has items about Harvard’s OA plans, University of Oregon Faculty Senate adopting a resolution in support of OA, the Budapest Open Access Initiative, OA in Italy … etc.
A slim number of the posts touch on Canada, and especially few on big announcements from Canadian universities and professional/scientific associations.
So, what is the state of OA in Canada? Where are all the initiatives? Where are all the Universities? Are they active, or are we happy, as a country, to lag behind the rest of the world?
Jim Till, of U of T, is writing a blog called: Be Openly Accessible Or Be Obscure, named after this article, which answers some of these questions.
Project Open Source | Open Access, also at U of T, is another place that ought to have some answers, since:
… phase II of the project will focus on research. We have identified Open Scholarship as the theme for 2007-2008, but we will also continue to build on faculty research strengths and interests in the design, development and use of open source environments for collaboration and learning; in institutional innovation; in OS business models; in open access journal publishing; and in the evaluation of journal impact factors.
Last update to their RSS feed was Oct 2007 … let’s hope there’s more good news to come.
So, how are we doing on OA in Canada?
DBpedia is a community effort to extract structured information from Wikipedia and to make this information available on the Web. DBpedia allows you to ask sophisticated queries against Wikipedia and to link other datasets on the Web to Wikipedia data.
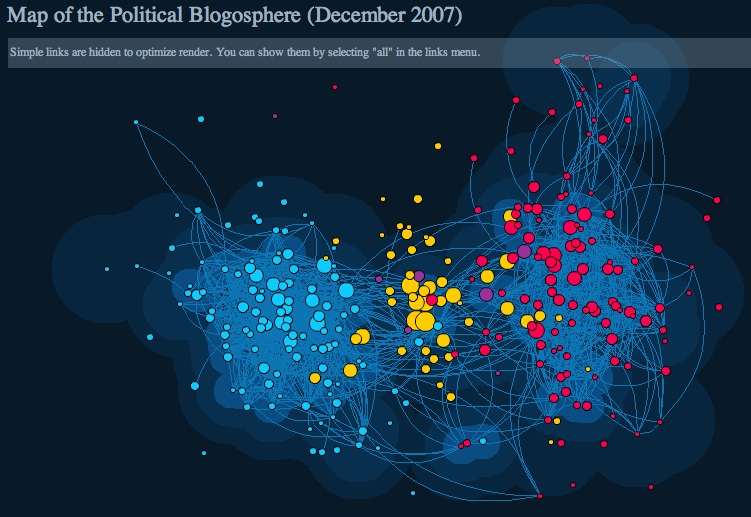 It seems that there is an explosion of data visualization work being done on the political process and the Presidential election in the US of A. I just landed on PresidentialWatch08 a site for all you political junkie/blogospheria/dataviz fans. They’ve got a lovely map of influential political blogs and news sites. The project seems to be run by a web analytics company, linkfluence.
Anyone planning anything similar in Canada?
[via infosthetics]
A short promotional video of the Stan’s Cafe performance installation, Of All The People In All The World, in which rice is used to represent human statistics.
[via infosthetics]
Civic data comes in many guises, and this is a neat way to analyze a politician’s speeches:
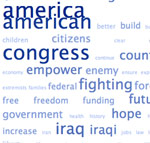
Last year’s 2007 State of the Union Tag Cloud was such a hit, I decided to follow up again this year…
[from Boing Boing]
Would be nice to do this systematically for every politician, maybe just based on their web pages? Or published documents, anyway.
Well, why not? Why not, indeed? Here is:
Stephen Harper:
adoption announces bachelor bookmark calgary canada canadian centre christmas co-founded committed commons community conservative cope costs criminal cut development e-mail economics election facebook family federal fostering funding greetings gst harper history house important increased independent later laureen leader leadership led maintain member minister mr national notices ontario page parliament party permanent pet photo pm power president prime print rachel record reform request rings saskatchewan seats statement stephen subsequent sworn system trust wait winning work year
created at TagCrowd.com
Stephane Dion:
accountability action affairs afghanistan against alone canada canadian change chr clarity climate conference conservatives continue contribute convention court de depth developed dion economy elected entering environment events federalism fend-for-yourself fight foreign fourth going government harper headlines helped heritage history institut iqaluit jean key kyoto leader leadership leaves liberal martin minister mismanagement mr opinion party phane policy politics politique prime promises protect received related riding sites speeches stories sustainable tien tv universit university visits volunteer work
created at TagCrowd.com
Jack Layton:
access affordable agenda books canada canadian care caucus city committed communities conservative contact convention council decades democrat education election federal foreign harper health history hudson include investing issued jack layton leader leadership martin member municipal ndp parliament party people photo policy proven providing public riding seniors stephen toronto university working
created at TagCrowd.com
Gilles Duceppe:
al au bec bloc campagne chambre chef cois commandites commission communes dans de du duceppe en est et faire financement fonctions gilles il int jour la le lu membre national nombreux notre nouvelles officielle ont opposition par pas principale qu qui raux re sident sur syndical travail tudiant une vous
created at TagCrowd.com
MySociety has released some very useful and sexy interactive travel-time maps for the UK using public data.

This is a most interesting use of political geodemographics – The Copyright MPs.
Ted at GANIS blog introduces this very interesting data visualization initiative – The British Columbia Atlas of Wellness.
Comments on Posts