Uncategorized

You are currently browsing the archive for the Uncategorized category.

TracingCOVIDbanners-08The following data and information were collected and analyzed by Tracey P. Lauriault, and Sam Shields a recent Carleton University Critical Data Studies graduate.

We set out to answer a very simple question inspired by a Twitter stream calling for COVID-19 reporting to include Indigenous, Black and Racialized characteristics. The following guided our activities:

  • What kind of demographic data are reported in official COVID19 reports?

On Thursday April 16, 2020 we spent the day searching the content of official government COVID-19 reporting sites. We compiled our data into a Google Spreadsheet, conferred over Skype, chatted in FB, and verified each other’s work. Official COVID-19 reporting dynamically changes as the pandemic evolves, and as institutions collect more data and build the capacity to report, they report more and they do so in a better way. I also consult experts in my network who comment and suggest resources. We will take another look next week to see if anything has changed. The following were our data sources

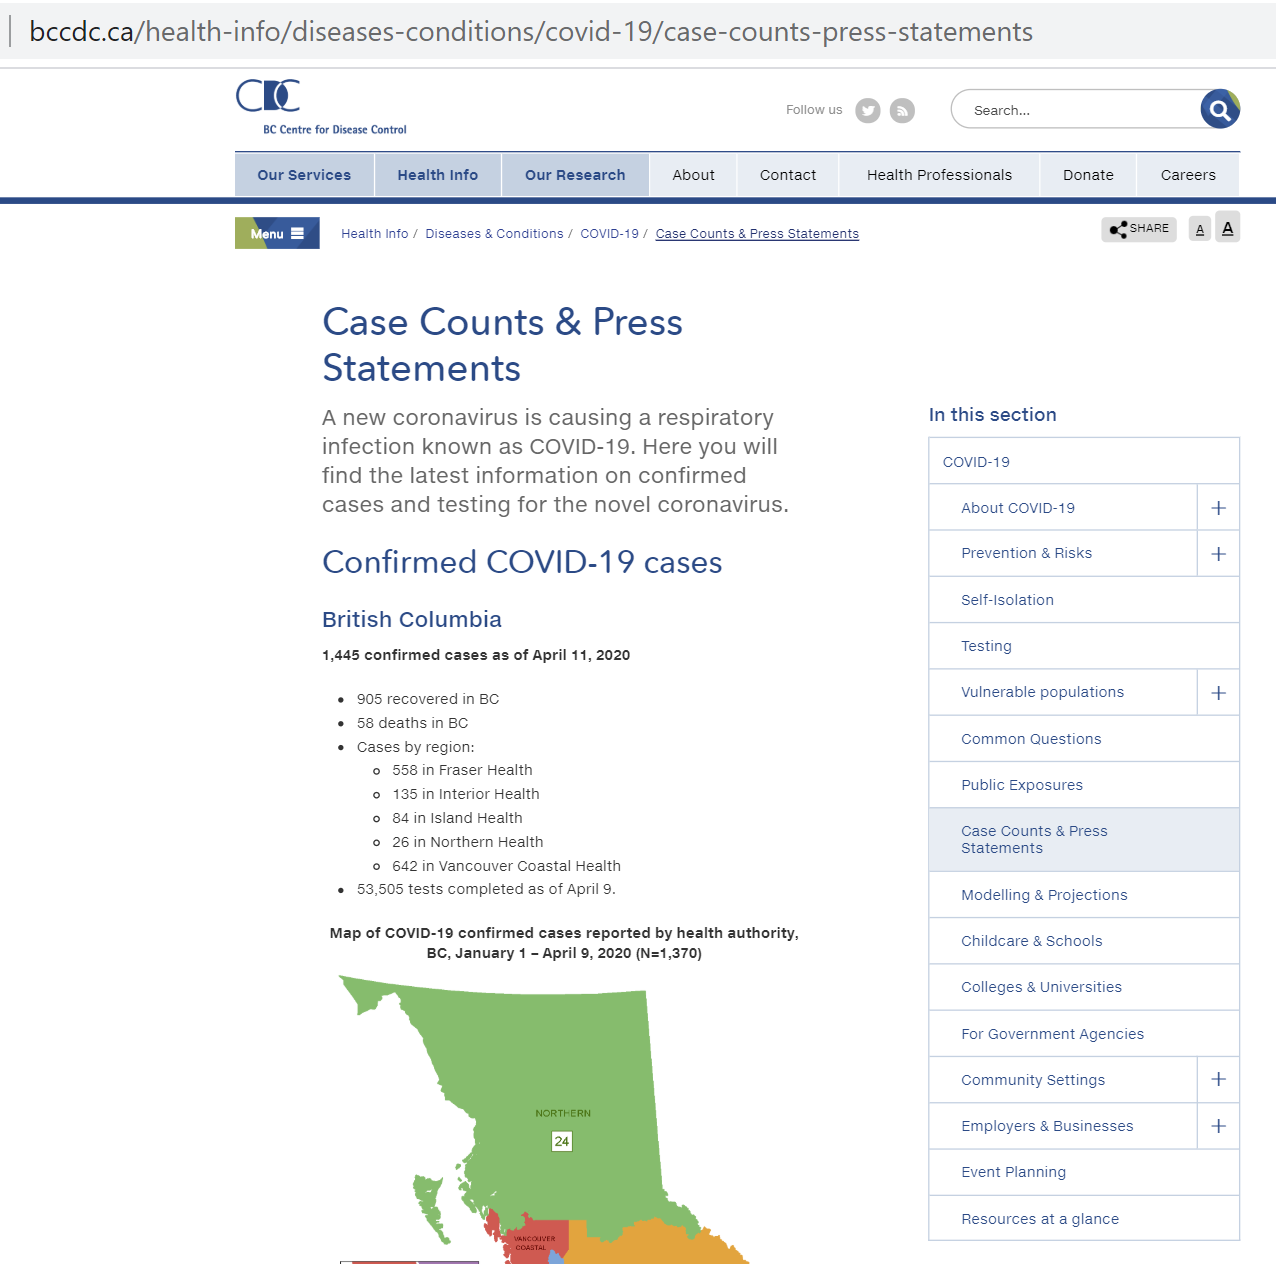
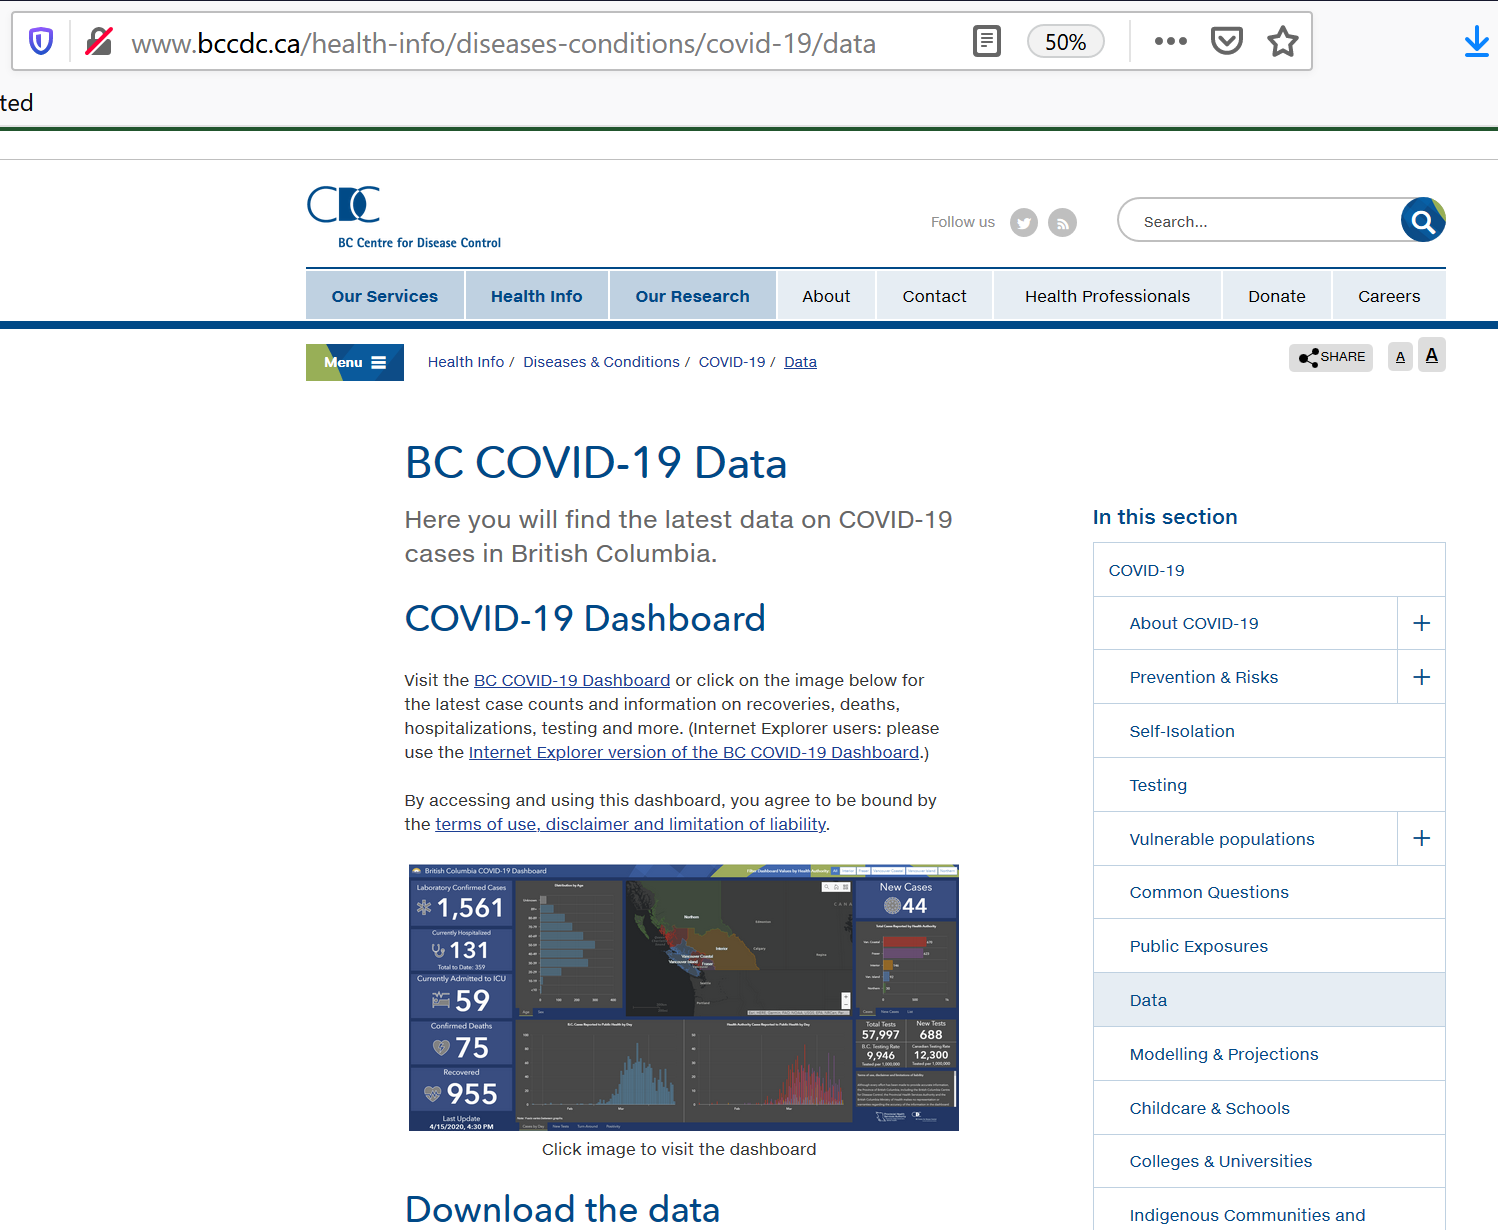
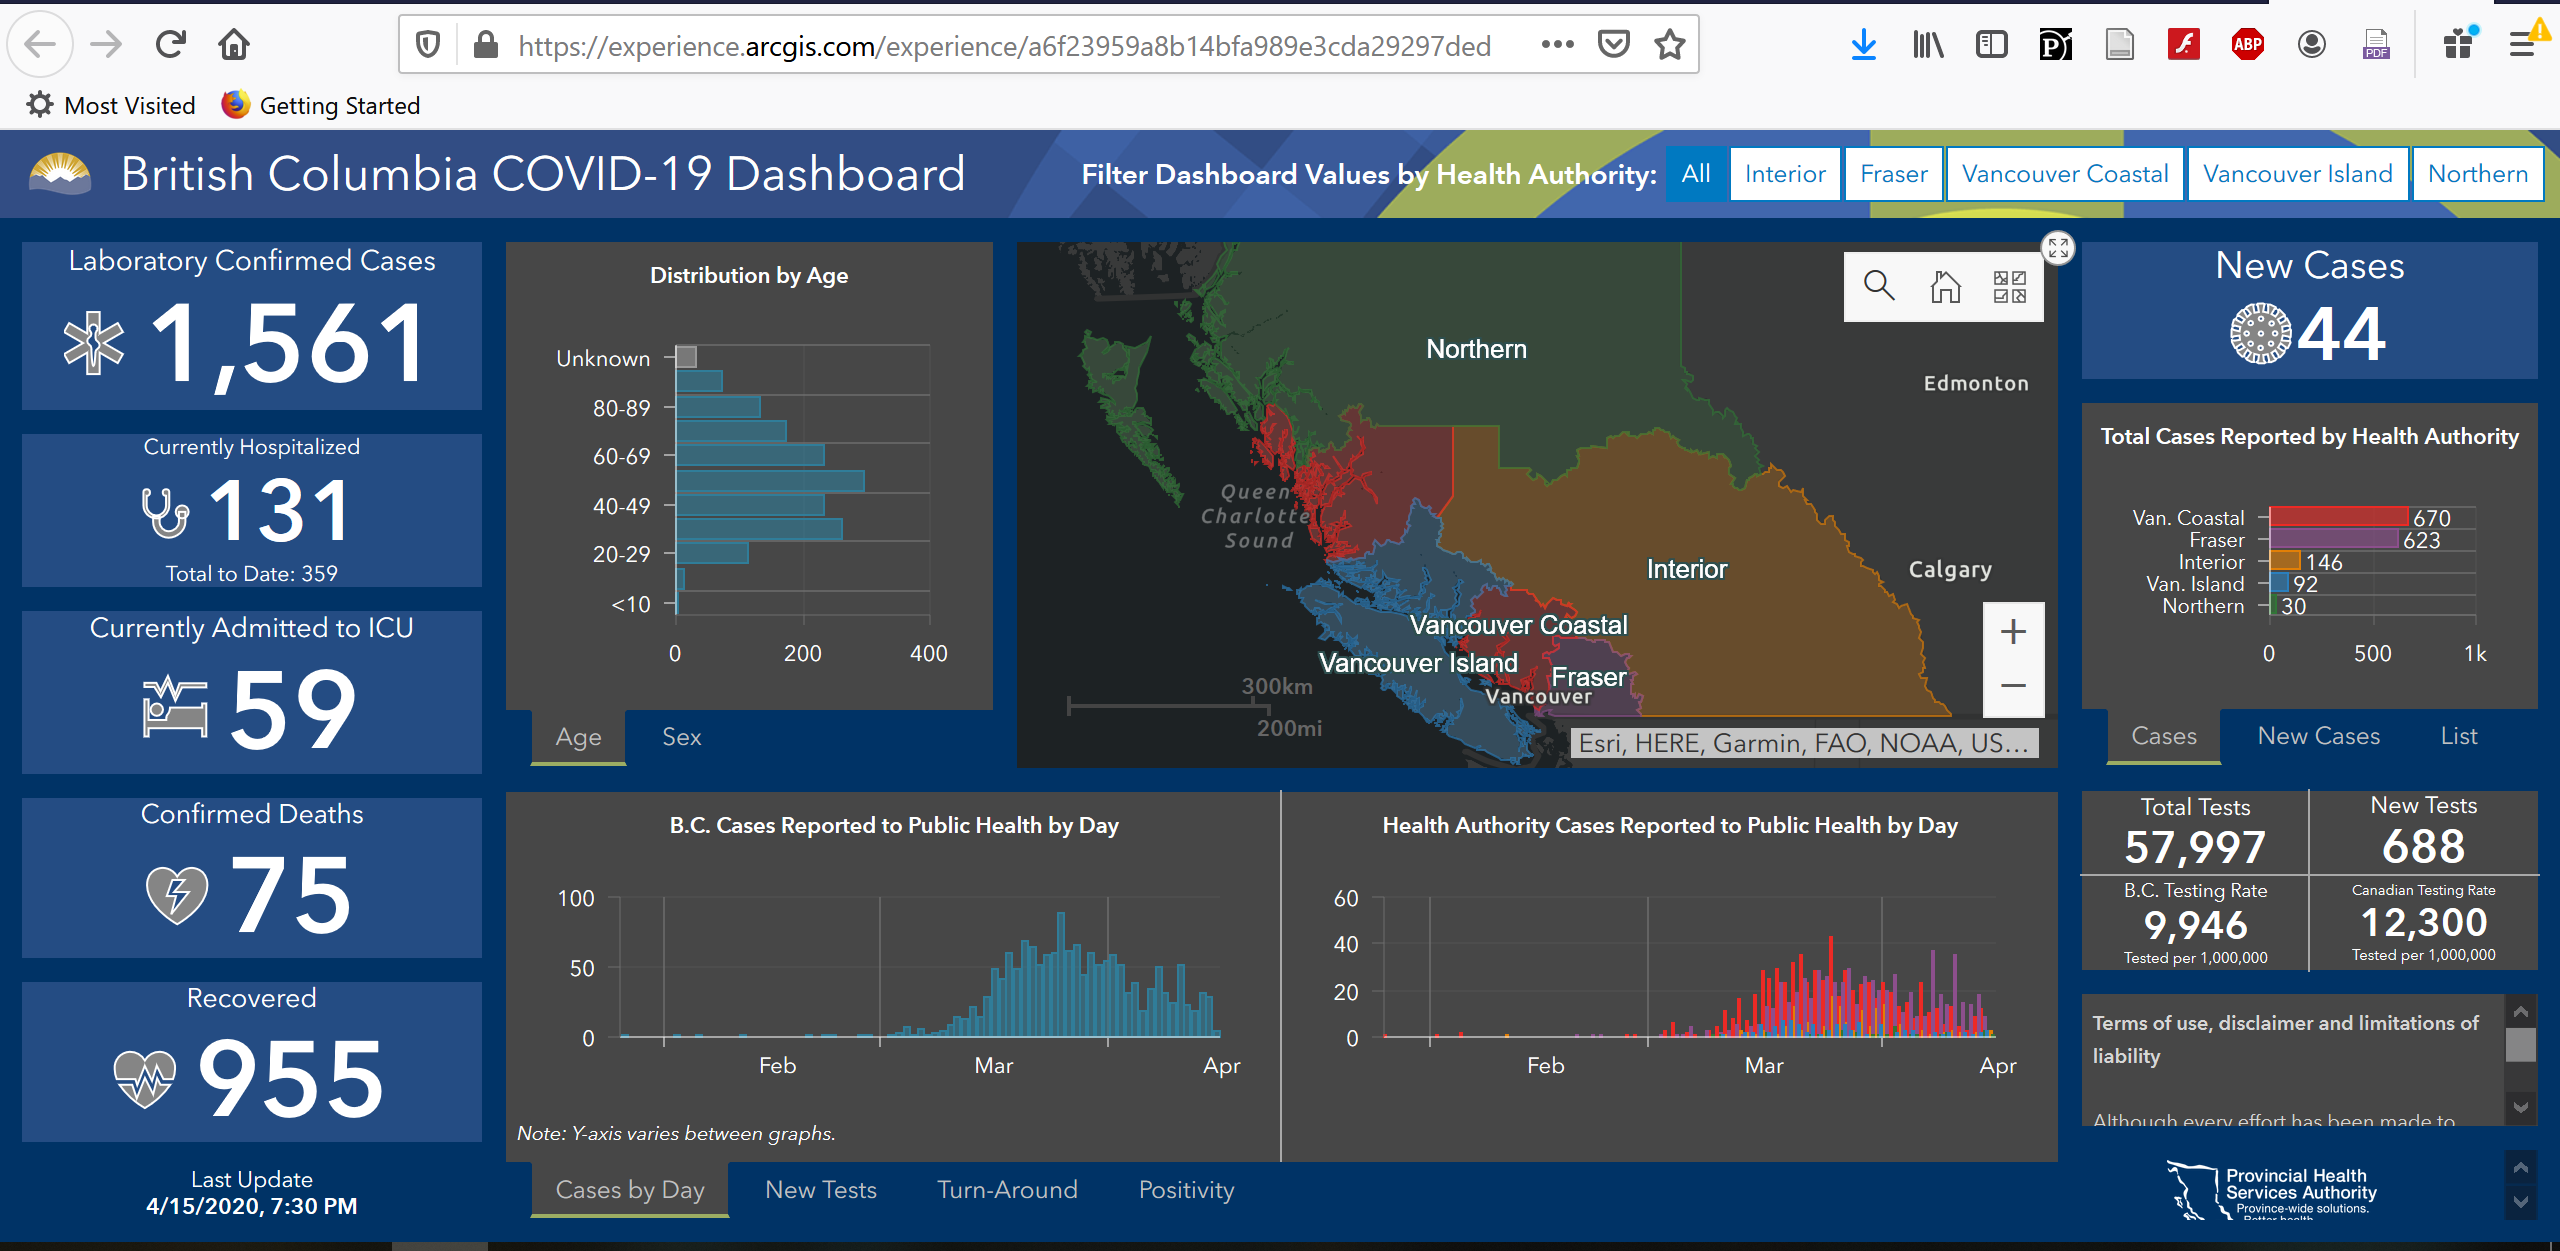
  1. British Columbia: COVID Dashboard & BCCCD PHSA Surveillance Report (15/04/2020)
  2. Yukon: Information about COVID-19
  3. Alberta: COVID-19 in Alberta
  4. North West Territories: Coronavirus Disease (COVID-19)
  5. Saskatchewan: Cases and Risk of COVID-19 in Saskatchewan
  6. Manitoba: COVID-19 Updates
  7. Nunavut: COVID-19 (Novel Coronavirus)
  8. Ontario: The 2019 Novel Coronavirus (COVID-19) Status of cases in Ontario & Daily Epidemiologic Summary (15/04/2020)
  9. Québec: Données COVID-19 au Québec & Situation du coronavirus (COVID-19) au Québec
  10. New Brunswick: COVID-19 Testing by the Numbers
  11. Prince Edward Island: PEI COVID-19 Testing Data
  12. Nova Scotia: Novel coronaviris (COVID-19) cases in Nova Scotia: data visualization
  13. Newfoundland: Newfoundland and Labrador Pandemic Update Data Hub
  14. Federal: PHAC Coronavirus disease (COVID-19): Outbreak update & Full Daily Epidemiology Update (April 16, 2020)

We found an incredible amount of information and overall, each province, territory and the Federal government make their data readily available and these are disseminated in charts, tables, maps, and dynamic dashboards and in daily surveillance reports. The data and indicators are explained, and data sources are generally provided.

In terms official COVID-19 reporting, there was very little reporting cases and outcomes with demographic variables and when there was, it is not standardized, making it difficult to do any national comparative analysis.  Below is what we found.

1. Age

  • COVID-19 Cases by Age were reported by all provinces and the Federal Government. Age was not reported by all 3 Territories.
  • Those who did report, provided case counts and some percentages.
  • Only British Columbia, Alberta and Quebec reported Deaths by age groups.
  • Quebec reports age in 4 different ways.
  • There are no Age Range Reporting standards, and this impedes comparability.

The following is how COVID-19 Age data are reported, we ordered the results by similar reporting styles.

  • British Columbia: <10, 10-19, 20-29, 30-39, 40-49, 50-59, 60-69, 70-79, 80-89, 90+, Unknown
  • New Brunswick: <10, 10-19, 20-29, 30-39, 40-49, 50-59, 60-69, 70-79, 80-80, 90+
  • Manitoba: 0-9, 10-19, 20-29, 30-39, 40-49, 50-59, 60-69, 70-79, 80-89, 90-99, 100+
  • Quebec: 0-9, 10-19, 20-29, 30-39, 40-49, 50-59, 60-69, 70-79, 80-89, 90+, Unknown
  •                 0-29, 30-39, 40-49, 50-59, 60-69, 70-79, 80-89, 90+
  •                 30-49, 50-69, 70-79, 80-89, 90+
  •                 <30, 30-39, 40-49, 50-59, 60-69, 70-79, 80-89, 90, Unknown
  • Alberta: <1, 1-4, 5-9, 10-19, 20-29, 30-39 ,40-49, 50-59, 60-69, 70-79, 80+
  • Saskatchewan: <19, 20-44, 45-65, 65+
  • Ontario: <19, 20-39, 40-59, 60-79, 80+
  • Federal: 19, 20-29, 30-39, 40-49, 50-59, 60-69, 70-79, 80+
  • Nova Scotia: 0-19, 20-44, 45-64, 65+
  • PEI: <20, 20-39, 40-59, 60-79, 80+
  • Newfoundland: <20, 20-39, 40-49, 50-59, 60-69, 70+
  • Yukon:  No Reporting by Age
  • North West Territories: No Reporting By Age
  • Nunavut: No Reporting By Age

Age range variable reporting recommendations:

a) Standardize age ranges reporting systems across jurisdictions to enable comparison.

b) Social-determinant of health variables, such as occupation, income, the type of dwelling a person lives in, where one lives, are variables being reported as being related to COVID-19. The Census reports age by quintile although it start at 0-14, in Canada vital statistics are reported by age quintile and the World Health Organization (WHO) also reports by quintile. Linking to other aggregated demographic, health and vital statistical data can inform the planning, and the managing of health outcomes.

2. Sex

  •  Sex is Not reported as a COVID-19 attribute, by 4 Canadian jurisdictions, namely the Territories and  Newfoundland and Labrador.
  • For jurisdictions that do report COVID-19 data by sex, only binary classifications are used, Female and Male.
  • Only British Columbia, Alberta and Manitoba report Sex and Age as attributes.
  • Only Quebec and The Federal Government report Sex and Death.

Sex Variable Reporting Recommendations:

a) It is advisable to report COVID-19 indicators by sex such as Female, Male and Gender Diverse.

b) Sex disaggregated data are important in terms of informing testing; health interventions and it is associated with health outcomes. Knowing can inform planning.

c) Reporting age and sex is important as these are distinguishing characteristics in vital statistics, health, wellbeing, for longevity and death rates.  Also, reports suggest that the virus affects men more negatively than it does women, especially older men. In terms of the labour force and COVID-19, nurses, doctors, elder care and home care professionals, those who work with people who live in group homes for the disabled and provide home care for these people, and people who clean these places tend to be women. Higher numbers of women are becoming afflicted by COVID-19 in Canada and this may be associated with their occupations. Age and sex are standard labour force statistical variables and reporting these attributes with COVID-19 will inform if health outcomes are related to those attributes.

3. Labour Classification

  • In official COVID-19 reporting, only the Provinces of Saskatchewan and Quebec reported any labour category and respectively they reported Case Counts for Health Care Workers for Saskatchewan and Cases Count and Death Count of Staff in hospitals and long-term care homes for Quebec.

Labour Force Reporting Recommendations:

a) Canadian Labour Forces Characteristics such as employed full or part-time, and the North American Industry Classification System and National Occupation Classification (NOC) system are standardized. For example, see the NAICS Health Care and Social Services or the classification and search for cleaner in NOCS.

b) The Canadian Institute for Health Information (CIHI) health workforce database includes standardized job classifications and data tables by job classification. They also have methodological guides comparing provincial systems. Harmonizing classifications across the provinces and the territories would go a long way to facilitating comparable analysis.

4. Indigenous, Black and Racialized People

  • No official government COVID-19 sites report data by any of these groups.
  • Race and ethnicity may or may not biologically predispose people to COVID-19 health outcomes.  We are assuming that these data are being tracked but are not reported as there is a concern about how to report these data.
  • Indigenous, Black and Racialized people may also have preexisting health conditions that are socially and economically determined, and these preexisting conditions may disproportionally affect this group more than others. Furthermore, reports suggest that Indigenous, Black and Racialized People have been infected more than others, and their health outcomes are more dire. Evidence informed decisions can lead to better outcomes for some groups, reporting the numbers can advance better and more targeted practices in community, hospital and in our cities.

Recommendation on the Reporting with Indigenous, Black and Racialized People categories:

a) The Province of Ontario Anti-Racism Directorate publishes a Data Standards for the Identification and Monitoring of Systemic Racism that includes

“guidance for race-based data collection for government and other public sector organizations, including steps to follow for data collection, management and use”.

Table 1. Valid Values for Race Categories on P.26 provides a useful classification system.  The Standard also includes protocols for the collection of self reported or observed data.

b) First Nation, Metis and Inuit in Canada may be collecting these data in their communities.  I will consult to see if that is the case and report back.

Final Remarks:

Health outcomes are intersectional, and age, sex, workforce and equity data provided additional insight about who is being affected, and knowing who and where can inform decisions about determinants of health, testing, improvement of health outcomes and planning. We have provided some insight in this post, about what is being reported and provided some recommendations. We will provide updates as more information is collected. We hope you find this useful and we welcome your comments and suggestions by email: tracey.lauriault@carleton.ca or on Twitter @TraceyLauriault.


Tags:

Reporting is becoming more sophisticated. The BC Centre for Disease Control (BCCCD) went from this landing page on the 13 of April, 3 days ago with data, maps, and charts as images on the page.

BC_CaseCountsPressStatement_BCCDC_13042020

To this page today 16 of April and data are now reported in an ESRI dashboard, and some data available for download! I think it is easier to read. I hope they will continue to report their excellent Surveillance Reports, here is an example from April 15, 2020. You can access those reports at the bottom of the landing page. What is great about the dashboard is that it is a collaboration between a number of Provincial Agencies BCCDC, PHSA, B.C. Ministry of Health and GeoBC Production. Below the image I have also pasted what they include on their Terms of Use, Disclaimer and Limitations of Liability page from the Dashboard.  The one issue with the dashboard, is you cannot download or link to specific pages.

BC-BCCDC_LandingPage_16042020
BC_COVID19_Dashboard_16042020

Below I copied and pasted the information directly from the Dashboard at 9:45 AM EST, 16 April 2020. It is useful to have this all in one place, including access to data, data sources and notes about the indicators. This comes from the Dashboard, and unfortunately I cannot hyperlink directly to this information.

Terms of use, disclaimer and limitations of liability

Although every effort has been made to provide accurate information, the Province of British Columbia, including the British Columbia Centre for Disease Control, the Provincial Health Services Authority and the British Columbia Ministry of Health makes no representation or warranties regarding the accuracy of the information in the dashboard and the associated data, nor will it accept responsibility for errors or omissions. Data may not reflect the current situation, and therefore should only be used for reference purposes. Access to and/or content of this dashboard and associated data may be suspended, discontinued, or altered, in part or in whole, at any time, for any reason, with or without prior notice, at the discretion of the Province of British Columbia.

Anyone using this information does so at his or her own risk, and by using such information agrees to indemnify the Province of British Columbia, including the British Columbia Centre for Disease Control, the Provincial Health Services Authority and the British Columbia Ministry of Health and its content providers from any and all liability, loss, injury, damages, costs and expenses (including legal fees and expenses) arising from such person’s use of the information on this website.

BCCDC/PHSA/B.C. Ministry of Health data sources are available at the links below:

Dashboard Usage Tips:

  • Hover over charts to see additional information.
  • Click the top right corner of any chart/window to make it full screen. Click again to return to the dashboard view.

Data Sources:

  • Case Details and Laboratory Information Data are updated daily Monday through Friday at 5:00 pm.
  • Data on cases is collected by Health Authorities during public health follow-up.
  • Confirmed cases include laboratory positive cases.
  • Laboratory data is supplied by the B.C. Centre for Disease Control Public Health Laboratory; tests performed for other provinces have been excluded.
  • Data on intensive care unit (ICU) admissions is provided by the PHSA Critical Care Working Group.
  • Test and case values may differ between amalgamated Health Authorities and B.C. as site locations are confirmed.

Data Over Time:

  • The number of laboratory tests performed and positivity rate over time are reported by the date of test result. On March 16, testing recommendations changed to focus on hospitalized patients, healthcare workers, long term care facility staff and residents, and those part of a cluster or outbreak who are experiencing respiratory symptoms. The current day is excluded from all laboratory indicators.
  • The number of new cases over time are reported by the date they are notified to public health.

Epidemiologic Indicators:

  • Cases are considered recovered after two lab-confirmed negative swabs taken 24 hours apart or when removed from isolation 10 days after symptom onset.
  • New cases are those reported daily in the PHO press briefing and reflect the difference in counts between one day and the next as of 10:00 am. This may not be equal to the number of cases reported by day, as cases reported prior to 10:00 am would have been included as New Cases in the previous day’s count. Because of the 10:00 am cut-off, the most recent day in time series graphs may contain only partial information. On Mondays, the number of new cases includes the number of new cases from Saturday and Sunday.
  • ICU values include the number of COVID-19 patients in all critical care beds (e.g., intensive care units; high acuity units; and other surge critical care spaces as they become available and/or required).

Laboratory Indicators:

  • Total tests represent the cumulative number of COVID-19 tests since testing began mid-January. Only tests for residents of B.C. are included.
  • New tests represent the number of COVID-19 tests performed in the 24 hour period prior to date of the dashboard update.
  • COVID-19 positivity rate is calculated as the number of positive specimens that day/total number of specimens tested (positive, negative, and indeterminate) that day.
  • Turn-around time is calculated as the daily average time (in hours) between specimen collection and report of a test result. Turn-around time includes the time to ship specimens to the lab; patients who live farther away are expected to have slightly longer average turn around times.
  • The rate of COVID-19 testing is defined as the cumulative number of people tested for COVID-19/BC population x 1,000,000 population. B.C. and Canadian rates are obtained from the Public Health Agency of Canada’s Daily Epidemiologic update site.

Health Authority Assignment:

  • Health Authority is assigned by place of residence; when not available, by location of the provider ordering the lab test.

Please direct questions and feedback to the BCCDC: Admininfo@bccdc.ca

Tags: ,

TracingCOVIDbanners-08It is very odd that national health organizations are not reporting COVID-19 cases aggregated into health regions even though provinces and territories are mostly reporting them in that way. And where is the national health framework datasets?

Framework data are a “set of continuous and fully integrated geospatial data that provide context and reference information for the country. Framework data are expected to be widely used and generally applicable, either underpinning or enabling geospatial applications” P.7.

Federal Electoral Districts for example, are the official framework data for Elections Canada and these data are updated for each election.  They are used to administer elections, report the results of exit polls during the elections, and show the results after an election.  Framework data are available in multiple formats as well as in cartographic or mapping products for Geographic Information Systems (GIS) such as ESRI, MapInfo or Tableau (Shapefiles), in KML formats for GoogleMaps, and in standardized online mapping GML Formats which also happens to also be a Treasury Board Secretariat of Standard for Geospatial Data. Election result data are aggregated into these framework data along with other socio-economic data, and once these data are mapped we can compare and can tell a more nuanced local, regional and national story, we can see patterns across the country.  The benefit of framework data are many, what is also great is they are created once by an authoritative source, they are updated and reliable, they are used many times, they are open data and everyone knows where to get them.

Considering that health care spending is one of the largest expenditures we have as a nation state, and it would be expected that in an era of accountability and transparency and where outcomes based management is the norm, it is astonishing that health data including its social determinants data are not disseminated in this way.  Yes, there are privacy issues, but we are capable of addressing those with the Census and Elections, which means we can also do so for health. We need to have an evidence based conversation about population health now more than ever, and we will need these data to tell a socio-economic story as well. Could we have done better? Who is doing great and why and who is not doing so great and why, what can we learn and what is the remedy?

Numerous useful and insightful interactive maps were published after the elections (CBC, CTV, Macleans, ESRI and many others), and these generated much discussion, people could see the results, they could situate themselves, they could see what friends and family in other places were experiencing.  Analysts and policy makers also had what they needed to understand and plan a new context. This is what democratic evidence based data journalism and policy making is all aboutt!

Natural Resources Canada is normally the producer of Canada’s framework data but it does not produce a health region framework dataset for Canada.  Arguably, these data would not only be useful during a pandemic, but also for administering and reporting health associated with natural resources such as allergies in the spring and fall, food insecurity, health and farming, or health after a natural disaster such as flooding and fires.  They data would also be useful to see where money is spent providing Canadians with the evidence they require to advocate for change.

So why no national heath reporting by their administrative boundaries and where is the health region framework dataset?

National Health Reporting Canada:

Virihealth.com and ESRI Canada produced the the first National ge0-COVID-19 reporting:

https://virihealth.com/

https://virihealth.com/

https://resources-covid19canada.hub.arcgis.com/app/eb0ec6ffdb654e71ab3c758726c55b68

https://resources-covid19canada.hub.arcgis.com/app/eb0ec6ffdb654e71ab3c758726c55b68

Federal Government:

Canada as a federation has jurisdictional divisions of power, and one of those jurisdictional  divides is health. We have the Canada Health Care Act (CHA) that

“establishes criteria and conditions related to insured health services and extended health care services that the provinces and territories must fulfill to receive the full federal cash contribution under the Canada Health Transfer (CHT)”.

The Canada Health Transfer (CHT) provides long-term predictable funding for health care, on a per capital basis and

“supports the principles of the Canada Health Act which are: universality; comprehensiveness; portability; accessibility; and, public administration”.

The provinces and territories receive cash transfers to deliver health care to Canadians and health care data reporting is done by the each province and territory separately. This alone justifies the creation of a national health region framework dataset. Which organization should be responsible for it?

There are three main organizations which are part of the Canada Health Portfolio  that currently report official COVID-19 cases. At the moment, they do not publish COVID-19 case data by health regions.

Health Canada “is the Federal department responsible for helping Canadians maintain and improve their health, while respecting individual choices and circumstances.” Health Canada is an official and authoritative national source of COVID-19 data and it publishes the Coronavirus disease (COVID-19): Outbreak update. Reporting includes an interactive map and a line graph of data by Province and Territory.

https://www.canada.ca/en/public-health/services/diseases/2019-novel-coronavirus-infection.html

https://www.canada.ca/en/public-health/services/diseases/2019-novel-coronavirus-infection.html

Public Health Agency of Canada (PHAC) promotes and protects the health of Canadians through leadership, partnership, innovation and action in public health and it does so by: Promoting health; Preventing and controlling chronic diseases and injuries; Preventing and controlling infectious diseases; Preparing for and responding to public health emergencies; Serving as a central point for sharing Canada’s expertise with the rest of the world; Applying international research and development to Canada’s public health programs; and Strengthening intergovernmental collaboration on public health and facilitate national approaches to public health policy and planning. PHAC now disseminates an excellent interactive dashboard entitled the National Epidemiological Summary of COVID-19 Cases in Canada. Their data sources are: Public Health Agency of Canada, Surveillance and Risk Assessment, Epidemiology update; Natural Resources Canada – Grey basemap with Credit: COVID-19 Situational Awareness tiger team Powered by ESRI-Canada and COVID-19 Canadian Geostatistical Platform, a collaboration between Public Health Agency of Canada, Statistics Canada and Natural Resources Canada.

https://phac-aspc.maps.arcgis.com/apps/opsdashboard/index.html#/e968bf79f4694b5ab290205e05cfcda6

https://phac-aspc.maps.arcgis.com/apps/opsdashboard/index.html#/e968bf79f4694b5ab290205e05cfcda6

Canadian Institute for Health Research (CIHR) is the Government of Canada’s health research investment agency and its mandate is to “excel, according to internationally accepted standards of scientific excellence, in the creation of new knowledge and its translation into improved health for Canadians, more effective health services and products and a strengthened Canadian health care system.” Although a research funding organization, CIHR could publish a national framework dataset of health units to help researchers in Canada and to also to disseminate the findings of research either about COVID-19 or any other research according to those administrative boundaries. (Update 07/04/2020 CIHR does not have a framework data file)

A national non-governmental organization, the Canadian Institute for Health Information (CIHI) also disseminates national comparative health data, mostly about the administration of health and it would make sense for them to also publish data by health units and to have such a framework dataset. CIHI is an independent, not-for-profit organization that provides essential information on Canada’s health system and the health of Canadians. (Update 07/04/2020 CIHI does not have a framework data file). CIHI’s mandate is

“to deliver comparable and actionable information to accelerate improvements in health care, health system performance and population health across the continuum of care”.

Natural Resources Canada is the producer of most of Canada’s Framework data, and it could with the help of the Canadian Council on Geomatics Provincial and Territorial Accord could create this framework file and this was discussed at the 4th Annual SDI Summit meetings hosted in Quebec City in the Fall of 2019.

Statistics Canada produces Provincial and Territorial Health Geographies and it does seem to have a national GIS Health Regions: Boundaries and Correspondence with Census Geography file for 2018, and if that is the case, why are health geographies not reported by these boundaries? (Update 07/04/2020 StatCan has a 2018 GIS national health geography file).  Here is a PDF version of the 2018 map.

https://www150.statcan.gc.ca/n1/pub/82-402-x/2018001/maps-cartes/rm-cr14-eng.htm

https://www150.statcan.gc.ca/n1/pub/82-402-x/2018001/maps-cartes/rm-cr14-eng.htm

Provincial and Territorial Official COVID-19 Case Reports and health geographies:

Below I have compiled a list of official COVID-19 Case reporting by province and territory, and when I could find them, I included a link to health administration geographies. That does not mean that data are reported in maps, but data are generally tabulated according to health administration geographies.

Alberta

British Columbia

Manitoba (Updated RHA and Map info. 07/04/2020)

Newfoundland and Labrador (Updated RHA and Map info. 07/04/2020)

New Brunswick (Updated RHA and Map info. 07/04/2020)

North West Territories

Nova Scotia

Nunavut

Ontario

Prince Edward Island (Updated Health PEI info. 07/04/2020)

Quebec (Updated Map info 08/04/2020)

Saskatchewan

Yukon (Updated Health Region info. 07/04/2020)

I have emailed each of the Provincial and Territorial governments to confirm that I have the latest heath geography framework data.  I have received updates from Yukon, Quebec,  PEI, New Brunswick, and Manitoba, and have updated map data accordingly. I have also received correspondence from Statistics Canada, and CIHI.

For the moment ESRI Canada and some of the Provinces and Territories are reporting Official COVID-19 Cases by health region geographies.  Why aren’t Health Canada and the Public Health Agency of Canada doing so?  And where is the National Health Region Framework Data file?

MPs will be debating Bill C-626 which proposes amending the Statistics Act this Friday November 7 to:

Reinstate the long-form census and expand the authority of the Chief Statistician of Canada.

The first reading of the text of An Act to Amend the Statistics Act / Projet de Loi C-626 Prèmiere Lecture was done on Sept. 22, 2014.

It was tabled by Ted Hsu, Liberal Member of Parliament for Kingston.

Here are some resources:

  1. Fortunately, Evidence for Democracy has taken this on as a campaign, and the
  2. Save The Census folks are also keeping us up to date on this issue with their Facebook page.
  3. Ted Hsu also has some excellent information resources in the Bill C-626 Blog
  4. the Datalibre.ca blog has a number of resources, which you can search
  5. The Civicaccess.ca list also keeps an archives of all of its posts, and you can search find excellent resources there as well.
  6. OpenParliament.ca has the essentials about the Bill
  7. Canadian Centre for Policy Alternatives (CCPA) – All the latest on the census long-form debacle

Some recent articles:

ACTIONS:

Tags: , , ,

As discussed here, and here, the folks on the CivicAccess.ca list are doing some digging into the numbers behind this Canada post announcement to cancel home delivery of the mail.  In addition, Armine Yalnizyan’s Globe and Mail Article Canada Post’s vow to ‘protect taxpayers’ needs a reality check which questions the validy of reported losses in financial reports.  As part of that digging some of the following links are being made.  And of course the following National Post Article Canada Post CEO Deepak Chopra is a board member of the think-tank that urged mail changes revealed that:

Chopra is also paid the highest salary range among so-called governor-in-council cabinet appointments, with potential earnings of more than half a million dollars a year as Canada Post CEO. Chopra is paid at the CEO 8 level, meaning he receives between $440,900 and $518,600 a year in salary to head an organization that has nearly two dozen presidents and vice-presidents.

Here are some findings about the CEO, his relationship with the Conference Board of Canada and also with Pitney and Bowes which runs a private sector mail service:

reorganized the postal business into two distinct business units: a Physical Delivery Network, which offers highly competitive mail and parcel delivery to every household; and a Digital Delivery Network, which is responsible for the epost electronic delivery solutions, online properties and consumer experience while supporting the Direct Marketing industry with location data analytics.

The report, L’Avenir du service postal au Canada / The Future of the Postal Service included some numbers and references to some interesting data shops as follows:

  • The econometric analysis discussed in chapter 1 of this report was done by ZenithOptiMedia is also a media agency with shops in Toronto and Montreal. The algorithms were not provided nor the data sources. It is a big data analytical shop
  • Dunn and Bradsheet supplied some corporate data.  According to them, they are “the world’s leading source of commercial information and insight on businesses”.  They also do credit scores.
  • Genesis Public Opinion Research Inc did the public opinion research. Not much is available about this company, they do however have a standing offer with the Government of Canada to do this this type of research.  And if this link to them is correct they are a shop based in Chelsea, QC with one employee? s http://www.salespider.com/b-143469756/genesis-public-opinion-research-inc, one employee?

The data from which it was decided that Canada Post should change its direction was not provided in the report, the following was:

  • “The target sample included approximately 500 customers who get mail delivered to their door (DTD), 300 who use group mailboxes (CMB), 250 who receive mail in their lobby or common area (LBA), 100 who have mail delivered to the end of their driveways (RMB), and 60 who have postal boxes in Canada Post or private buildings (DFLB). This roughly mirrors the current distribution of customers by delivery category, with an oversample of rural driveway customers”.
  • “A total of 1,212 residential customers, 18 years of age or older, were surveyed by telephone from September 26 to October 10, 2012. The results are considered accurate to within +/- 2.8 per cent, 19 times in 20.”
  • “Genesis explored the views of small businesses through a two-stage process. The first stage was a series of five focus groups, held in Moncton, Montréal, Mississauga, Brandon, and Calgary. The second stage involved a telephone survey of individuals in small businesses who make decisions on postal products and services within their company.”
  • “The interviews were conducted with 800 businesses selected randomly from among a nationwide pool of businesses with more than 1 but fewer than 100 employees. The sample was generated using data from Dunn and  Bradstreet. The source data for the sample were stratified by employee size, region, and Standard Industrial Classification (SIC). Only businesses with 2 to 100 fulltime employees were eligible for inclusion in the final sample. The sample was then randomly drawn from businesses across the full range of over 1,000 SIC codes, but it excluded Canada Post, print and electronic media, hospitals, educational institutions, and all three levels of government”.

To summarize, this unbiased report was produced by an organization, who has as its board member, the proponent of the research who also happens to be the CEO of the Crown Corporation which is proposing the radical changes, furthermore, this CEO was also the president and CEO of a company that has a private sector mail service that may benefit from these changes, and he is paid close to 520K per year by the Crown / governor in council who appointed him, of an organization that is fasely reporting losses.  In addition the data sources and algorithms behind the reports are not made available, while the sampling of the population is small and primarily urban and even these small numbers were also misreported.

Maybe it is just me, but it would seem that something is a little off here. And, there seems to be a pattern, the cancelation of the census in 2010 was announced just before the summer holidays, the cancelation of home delivery of the post was announced just before the Xmas holidays of 2013, and we have a Prime Minister who seems to have an aversion to evidence based decision making.

It would be good to know who stands to gain with this Canada Post decision, a quick glance tells me that the Canada Post Digital Delivery Network, Direct Marketing industry with location data analytics gain, and that would include companies like Pitney and Bowes, while the Physical Delivery Network which is the one that serves the public, loses.

Jean-Noe Landry and Tracey P. Lauriault have an article entitled:

Les données ouvertes : la matière première du nouvel engagement citoyen

in this fantastic almanac type of publication produced yearly by L’institut du nouveau monde. The article features the unique type of open data movement in Quebec, which is a rich combination of  community development, grass roots engagement, technological activism and public policy making.  It is one of the few Canadian open data initiatives that really make data work to change public policy by embedding the work into a political process, while concurrently working within the political process to ensure evidence informed democratic deliberation and keeping government accountable.

etatduquebec

L’État du Québec est publié une fois l’an depuis 1995. Destiné au grand public, il fournit aux lecteurs l’ensemble des données factuelles utiles sur le Québec dans tous les domaines. On y trouve également le bilan politique, économique, culturel et social du Québec pour l’année écoulée ainsi que des textes d’analyse, produits par des spécialistes, sur tous les grands enjeux auxquels le Québec est confronté.
UN GRAND DOSSIER : LE POUVOIR CITOYEN
• Historique de la participation publique au Québec
• L’éducation civique à l’école
• Les formes innovantes de la démocratie participative à travers le monde
• Le mouvement des données ouvertes
• Participation et corruption coexistent : comment l’expliquer ?


The article was co-authored by both of us, however, it is important to mention that Jean-Noe, in his true collaborative, consultative and democratic style, consulted a number of actors in the Montreal and Quebec open data space to ground the content in its local context.

On a seperate note, it is serendipitous that Jean-Noe read philosophie at Trinity in Dublin, I now live in Ireland, we both travelled in Japan and his mom was my French prof.  Life is very interseting sometimes!

Greetings folks!  Below is a presentation about the genealogy of open access to data and open data in Canada.  It was great to finally have the space to demonstrate the earlier work done in this space and to showcase the different open data open access communities.  The open data movement has a long history in Canada, and I believe we can thank research librarians and geomaticians for getting the ball rolling, at least if we tentatively assume that it began in the 80s and the use of the Internet.  The history of sharing data in science and geomatics does however go way back.

The other presentations which were part of the Programmable City Seminar discussed the Irish context at a County Council called Fingal level and the Irish Environmental Protection Agency.  They were great as they featured what it means for a public servant, citizen and a researcher to do this work.  Folks who follow open data in Canada would have been most impressed by their frank talks and their oratorial styles.  A video will be released in the coming weeks.

Author: Liam Currie

Title: The Role of Canadian Municipal Open Data Initiatives: A Multi-City Evaluation (2013) (Available here)

Abstract:

In this thesis I undertake a study of Canadian municipal open data initiatives in order to assess the current state of the programs and to gauge the role(s) that these initiatives may play in regards to improving public engagement in local government issues. After an initial literature review, I adopt two separate approaches. The first approach involves the creation of an inventory and evaluation of the contents of all twenty three (23) Canadian municipal open data catalogues in existence during the summer of 2012. The second approach involves asking questions of key informants in the field through the execution of nineteen (19) semi-structured interviews with open data experts from both government and civic realms in ten (10) case study cities across the country.

The results of the research illustrate the major differences and similarities between the structure, output, and roles of open data initiatives in various Canadian cities. The data provided by these programs mostly consists of politically neutral geographic data, though there are a few exceptions. I find two major program structures in Canadian cities: (1) The first type of open data program is created and operates within a specific municipal department and the (2) second type of program operates across a number of departments. Each approach has its own benefits and challenges. The open data initiatives across Canadian cities also appear to have different approaches to public engagement. Several cities have developed strong collaborative relationships with local open data advocates which are explored in some detail. Larger themes about the current state of open data, its current and future role, and the challenges faced by operators and users, are also described in this thesis. I conclude with some recommendations for improving municipal open data initiatives in the future.

M.A Thesis, August 2013
Department of Geography,
Queen’s University, Kingston, ON

Acknowledgements:

  • SSHRC – Funding
    Dr. Betsy Donald – MA Supervisor
  • Harvey Low, John Jones, Reham Gorgis-Youssef, Gina Porcarelli, Matthew Dance, Mack Male, Robert Giggey, Mary Beth Baker, Edward Ocampo-Gooding, Diane Mercier, Michael Lenczner, Andrew Durnin, Alyssa Daku, Andrew Dyck, Steve Czajka, Robert Lunn, Blair Labelle, Joey Coleman – Interview participants
  • Dr. Tracey Lauriault (Datalibre.ca, Civicaccess.ca), David Eaves (Eaves.ca), Dr. Michael Gurstein (Gurstein.wordpress.com), James Mckinney (Opennorth.ca), Keith Macdonald (City of Toronto), Cyrille Vincey (qunb.com), David Robinson (robinsonyu.com) – Additional input and support
  • The discussions and links hosted at the following blogs and listservs were also invaluable: eaves.ca, crookedtimber.org, gurstein.wordpress.com, datalibre.ca, civicaccess-discuss@civicaccess.ca, open-government@lists.okfn.org, open-data-census@lists.okfn.org

The first real open data project in Canada, is arguably, GeoGratis, launched in 1997. It disseminates geomatics legacy data, archived data or data used for independent research.  Like the DLI it used FTP in the early days of the Internet as a way to transfer data in the formats within which datasets were created and data transformation services were pointed to.  Today it disseminates data via a portal and other web services.  Geogratis is a Natural Resources Canada program, under the aegis of the Canadian Geospatial Data Infrastructure (CGDI) which is being devlivered by GeoConnections.  Shortly thereafter, as part of the CGDI, GeoBase was launched to disseminate free national scale framework data.  Both projects, unbeknownst to their creators, were revolutionary, Geogratis for launching the first free open data project at the Federal level, and Geobase as it was data being created as part of a provincial and territorial accord.  These innovations became even more significanr once a decision was made to share the data under an Unrestricted User Licence, a first for Canada. It was a way to work around Crown Copyright.  GeoConnections continues to be innovative in its data dissemination, open specifications, interoperability and standards based approach to data.  See their Operational Policies and other related documents to read more about their work. It is the gold standard in Canada, and most of the data found in the OpenData portal run by the Treasury Board Secretariat of Canada, are from Natural Resources Canada.

GeoGratis: A Canadian Geospatial Data Infrastructure Component that Visualises and Delivers Free Geospatial Data Sets (1999)

Abstract:

Many countries are in the process of setting up geospatial data infrastructures. The United States Federal Geographic Data Committee (FGDC) has assumed leadership in the evolution of the National Spatial Data Infrastructure (NSDI). Similarly, the National Geospatial Data Framework (NGDF) of the United Kingdom facilitates collaboration, standards and access to geospatial data. The Canadian Geospatial Data Initiative (CGDI) has five objectives to facilitate access, partnerships, framework data sets, supportive polices, and standards. GeoConnections is the program to build the CGDI. GeoGratis is an operational and fundamental component of Geo-Connections. The GeoGratis objective is to provide a wide range of free vector and raster geospatial data sets of the Canadian land and water mass to the public. During the early stages of GeoGratis, previously archived geospatial data sets were distributed using an Internet based File Transfer Protocol (ftp). Data sets include the Canada Land Inventory and a sample of panchromatic, multi-spectral and hyperspectral imagery. Recently implemented delivery methods are based upon the HyperText Transfer Protocol (HTTP) that permits the development of a friendlier user interface and a screen to capture a client’s profile. The client is prompted to download the file in the original format and projection or the user can change these parameters according to individual preference. GeoGratis supports the distribution of framework data sets that meet national and international standards. Free and open distribution ensures that these frameworks will be widely accepted. The National Atlas of Canada base maps are the essential framework data sets in GeoGratis. In Canada, GeoGratis reflects the philosophy that the widespread distribution of free or low cost geospatial data stimulates research and development, and promotes a more diversified user base. GeoGratis develops partnerships across government departments. Many departments are protected from the vagaries of the Internet by strong firewalls. The GeoGratis project provides a simple operational tool for these departments. Recognising the needs of a diverse and new user base, GeoGratis plans to use a variety of technologies that offer a range of interfaces to view and access the data sets. Levels of complexity range from simple bitmaps to a more complex on-line GIS with file conversion facilities. The GeoGratis project is developing database design, visualisation software and access methodologies, which may be applied to any country’s geospatial data infrastructure.

Authors:
Cameron Wilson, Canada Centre for Remote Sensing, Natural Resources Canada, Ottawa, ON, K1A 0E9 Canada
Robert. A. O’Neil, Canada Centre for Remote Sensing, Natural Resources Canada, Ottawa, ON, K1A 0E9 Canada

The DLI, is arguably, one of the first attempts by the research and university library communty to make census data accessible to Canadians.  The DLI cannot be considered an Open Data project since data are behind a paywall, irrespective, it was one of the first real lobby efforts to make data available, to work around StatCan’s (back in the day when we had a census) regressive cost recovery and data pricing policies.  The paper provides an excellent review of the history of data advocacy in this community of practice, introduces the associations and also discusses early Internet FTP data transfer, standards, and the data consortium or group purchase model.  Today the DLI serves thousands of faculty and students in research libraries, and its boot camps continue to provide ongoing education and builds capacity in Canadian Research Libraries.  Many of the organizations mentioned remain actively involved in Research Data Canada, the creation of trusted digital repositories and work on the preservation of research data.

The Canadian Data Liberation Initiative: An Idea worth Considering? an International Household Survey Network Paper

Abstract

The Data Liberation Initiative (DLI) is a Canadian program aimed at providing Canadian post secondary institutions affordable access to Statistics Canada data resources. It is a partnership between Statistics Canada and the academic sector. While it initially focused on the dissemination of public use microdata files it now encompasses all publically-available data. This paper describes the background of this project and some of the key success factors so that other agencies may be able to determine its applicability for their own situations. It was written in the hopes that other agencies may find the Data Liberation project as a useful model to consider. It was also written for a Canadian audience that is interested in the history of this project which has now been in operation for over 16 years.

Authors:

Ernie Boyko is a former staff member of Statistics Canada where he held a number of Directorships, including Agriculture, Corporate Planning, Electronic Publishing, and Operations for the 1991 Census. It was during his time at Statistics Canada that Wendy Watkins and he co-founded the Canadian Data Liberation Initiative. He is an active member of the Canadian Association of Public Data Users and the International Association for Social Science Information Services and Technology. He is currently an Adjunct Data Librarian at the Carleton University Data Centre and occasionally works on projects with the International Household Survey Network. .

Wendy Watkins is the Manager of the Carleton University Library Data Centre. Her inspiration for Data Liberation came while working at Statistics Canada for a two year period. She is a founding member of the Canadian Association of Public Data Users and active in the International Association for Social Science Information Services and Technology.

« Older entries § Newer entries »