campaigns

You are currently browsing the archive for the campaigns category.

The visuals I saw while watching the US elections on the tele on Tuesday were just plain dazzling.  Lots of speculative data, predictions, interactivity leading to scenarios and more speculation on the results, good visualizations, resulting from a visualization dissemination and creation infrastructure which manufactures the geographic imagination of the US Nation.  Obama stated in the speech that won him the candidacy for the Democrats (UK Guardian)

that there were no red states, no blue states, only the United States.

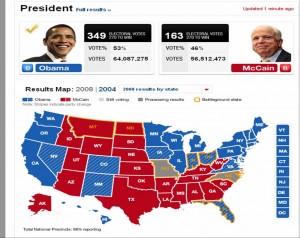
The maps we saw on US election night however, were all about blue and red differences.

Map of results by state

Map of results by state

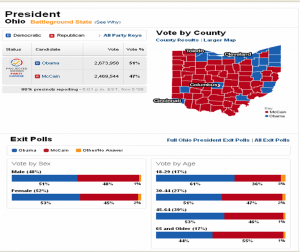
Zooming into county maps shows a different picture where colour speckles add up to a uniform blue for Ohio on the state map above. Many voices are not seen on the state map, the county map shows lots of diversity, as would the sub county map.  Maps tell all sorts of stories and can portray silences or consensus where in fact cacophonies and polarities exist. The county map looks way more red than blue for the Democratically won state of Ohio.

Speckles of red and blue in Ohio became a uniform Blue

Speckles of red and blue in Ohio became a uniform Blue

Reading about the US Electoral system helps explain how this works out.

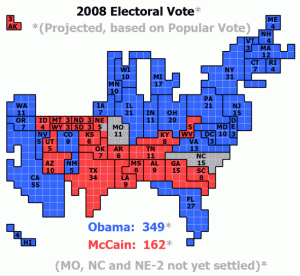
The map in popular culture is key to the formation of the collective imagination of the nation.  I do wonder if viewers will actually think that Hawaii and Alaska are really located in the ocean south of Arizona instead of one connected to Canada’s North and the other in the middle of the Pacific!

1 square = 1 electoral vote

1 square = 1 electoral vote

Information Aesthetics produced an excellent blog post which includes links to numerous electoral visuals.  Watching this also highlighted the lack of maps and visuals during the Canadian 2008 Elections.  Eventually I did see a map on the Tele, around 11:30 PM on Radio Canada, while CBC showed none!
ibelieveinopenVisiblegovernment.ca has launched a new site, ibelieveinopen, asking candidates (and citizens) to take a pledge for openness:

I believe candidates should:

  • Support reforms that increase government transparency and accountability.
  • Make campaign promises specific and measurable, and report progress on promises and their metrics at least semi-annually.
  • Publish the content of his or her daily schedule, including meetings with lobbyists and special interest groups.
  • Support reforms allowing free access to scientific and survey data gathered by government institutions.
  • Support reforms that make it easier for Canadians to obtain government information they have a right to know.

As of today, there are 51 candidate pledges (29 Greens, 21 NDP, and 1 Libera)l.

You might consider sending your candidates an email asking them if they intend to take the pledge. This is what I sent to my candidates:

Hello,

Will [Candidate Name] be signing this pledge?
http://ibelieveinopen.ca/

51 candidates have done so already.

Hugh McGuire

I dicovered DataPortability.org from some folks who are disturbed that their data stored in a system such as Facebook are not portable to other systems and that those data can disappear all together.

It is not what you think! It’s a visualization poling tool that shows what people think about a particular politician’s quote during an election, in this case the elections in Australia. Online opinion polls are always tricky, as they are driven by how the question is framed, the media outlet that poses it, they often miss the opinions of the non connected which are often those in rural and remote areas or of lower income or particularly less connected demographic groups. Nonetheless it is an interesting way to get a sense of what a select sub section of a population – connected, urban, msn news reader, literate with new media savvyness – thinks.

Passion PulsePassion Pulse Map

Via my Favorite: Information Aesthetics

From ie.blognation.com:

In a recent competition for the best idea for a webapp with an Irish focus, I was surprised to find several submissions were about citizen interaction with the public service and the Government. This set me thinking that we should not encourage the public service to build applications and sites but to build APIs for our data.

The key word is “our”. There is still a strong belief in the public service that somehow they own our data whether that is a hospital telling me I can only get my son’s x-rays through the Freedom of Information act, the Ordnance Survey keeping an iron-grip on GIS data or local government publishing data in proprietary Word docs and PDFs….

[thanks for the pointer, mat]

The Guardian UK Tech Section has an ongoing campaign to free UK government data, with an associated blog: freeourdata.org.uk/blog.

Their campaign inspired a response from the Ordnance Survey titled:
These maps cost us £110m. We can’t give them away for free
. The response argues that the maps cost money, that the OS needs money to operate, and that by charging for the maps they can continue to provide a valuable service. Among other things:

It cost Ordnance Survey £110m to collect, maintain and supply our data last year, but we are not “paid for by taxes”, as the campaign often claims. Instead, we depend entirely on receipts from licensing and direct sales to customers for our income – we receive no tax funding at all.

If we are successful, we can cover our costs, encourage widespread licensing through partners, and stay focused on providing value for users. Under licence, there are many examples where our data is free at the point of use. This does not mean there is zero cost.

[Interesting to note that the OS’s clients, much like statscan clients, are “users,” not citizens].

The Free Our Data people responded to response in their blog, noting the key reason for their campaign:

We believe [making OS data and maps free] would set off an explosion in private-sector use of the data, and lead to more companies which would create more jobs and generate more taxes. That would offset any extra taxation required to fund OS. Making the data free would also get rid of onerous and inefficient licensing schemes that tangle up central and local government departments, which wonder if they can reuse something or even display it on the web. (Search this blog for NEPHO.)

And that was followed by further response from Tom Steinberg and Ed Mayo, the authors of the Power of Information, who say:

The key issue about charging is whether the UK would benefit more in net terms from the more vibrant information market that more open information would bring than it would lose through having to find an additional £60m per year. This is a serious question that the Treasury is currently looking into, having accepted the recommendation in the independent review we co-authored for the government earlier this year.

[link to complete letter].

Which garnered some further feedback from the Free Our Data.

And in the end this is a compelling case, perhaps the compelling case: a case that ought to convince you whatever your political leanings, right or left or circular. There are moral and social and philosophical reasons to support free government data. But the one that’s most likely to win converts is the case that free data makes for more innovation. The innovation can be commercial, social, socioeconomic – touching on health, environment, planning, equality etc, but also just good old-fashioned economic vitality.

But all of it, we’d argue, will “make Canada a better country” not just morally, but in our ability to solve important problems, and, yes, make some people more money in the mean time. Which means, in the end, more tax receipts, which means that it should offset any lost revenues Statscan and other Canadian agencies now receive for excluding all but big companies and institutions from their datasets.

Newer entries »